| __timestamp | Allegion plc | Lennox International Inc. |
|---|---|---|
| Wednesday, January 1, 2014 | 2118300000 | 3367400000 |
| Thursday, January 1, 2015 | 2068100000 | 3467400000 |
| Friday, January 1, 2016 | 2238000000 | 3641600000 |
| Sunday, January 1, 2017 | 2408200000 | 3839600000 |
| Monday, January 1, 2018 | 2731700000 | 3883900000 |
| Tuesday, January 1, 2019 | 2854000000 | 3807200000 |
| Wednesday, January 1, 2020 | 2719900000 | 3634100000 |
| Friday, January 1, 2021 | 2867400000 | 4194100000 |
| Saturday, January 1, 2022 | 3271900000 | 4718400000 |
| Sunday, January 1, 2023 | 3650800000 | 4981900000 |
| Monday, January 1, 2024 | 3772200000 | 5341300000 |
In pursuit of knowledge
In the competitive landscape of the HVAC and security industries, Lennox International Inc. and Allegion plc have showcased remarkable revenue trajectories over the past decade. From 2014 to 2023, Lennox International Inc. consistently outperformed Allegion plc, with revenues peaking at approximately $5.34 billion in 2023, marking a 59% increase from 2014. Allegion plc, while trailing, demonstrated a robust growth of 72% over the same period, reaching around $3.65 billion in 2023.
The data highlights a pivotal year in 2021, where Lennox's revenue surged by 15% compared to the previous year, reflecting a strong recovery post-pandemic. Meanwhile, Allegion plc's steady climb underscores its resilience and strategic market positioning. As we look forward, the absence of 2024 data for Allegion plc leaves room for speculation on its future trajectory. This analysis offers a compelling glimpse into the financial dynamics of these industry leaders.
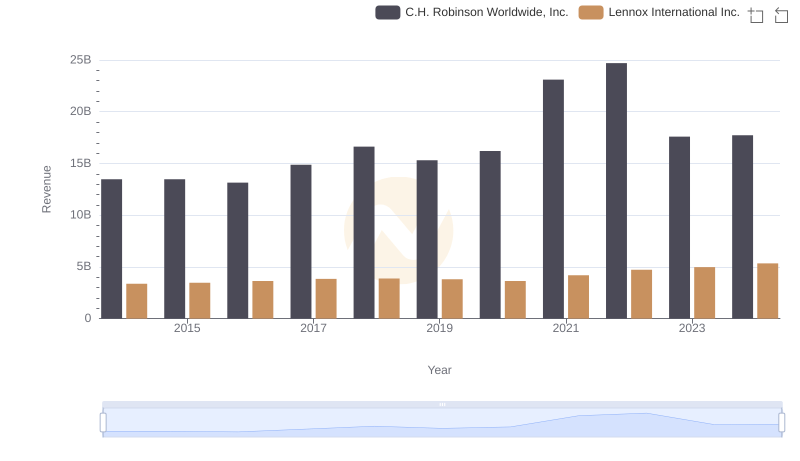
Revenue Showdown: Lennox International Inc. vs C.H. Robinson Worldwide, Inc.
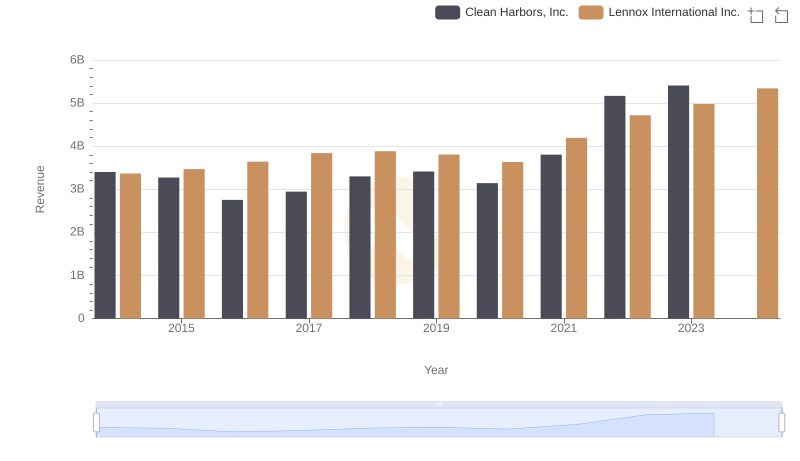
Comparing Revenue Performance: Lennox International Inc. or Clean Harbors, Inc.?
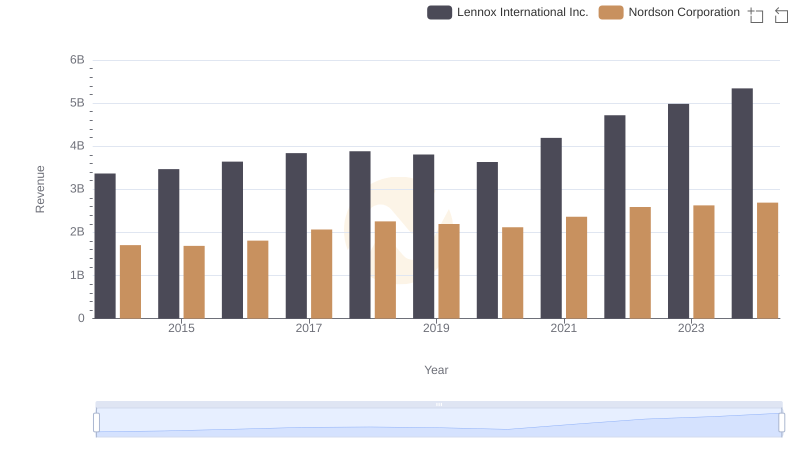
Revenue Showdown: Lennox International Inc. vs Nordson Corporation
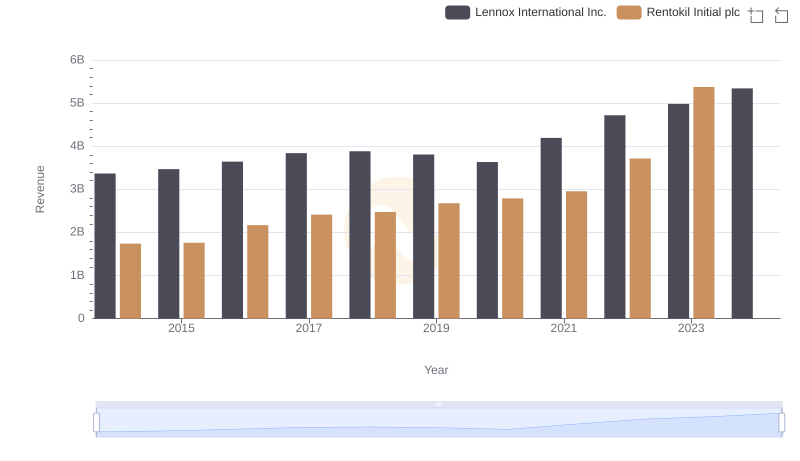
Annual Revenue Comparison: Lennox International Inc. vs Rentokil Initial plc
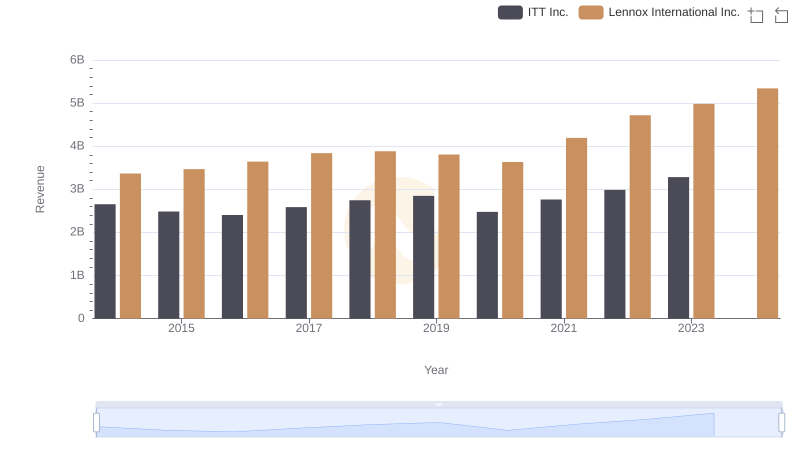
Annual Revenue Comparison: Lennox International Inc. vs ITT Inc.
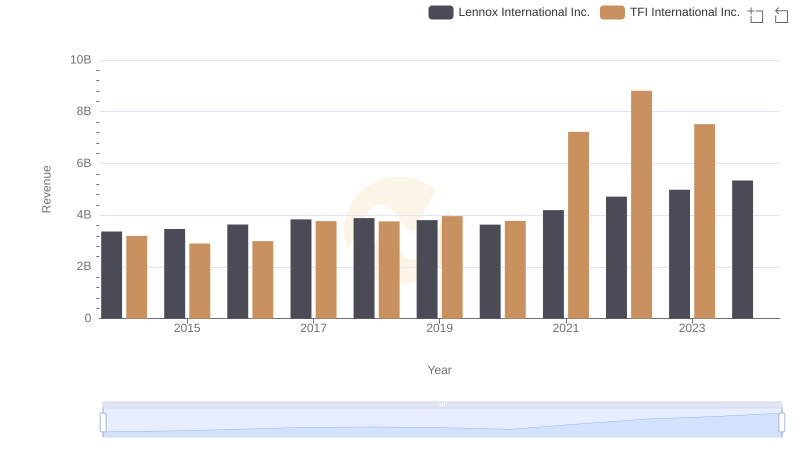
Lennox International Inc. and TFI International Inc.: A Comprehensive Revenue Analysis
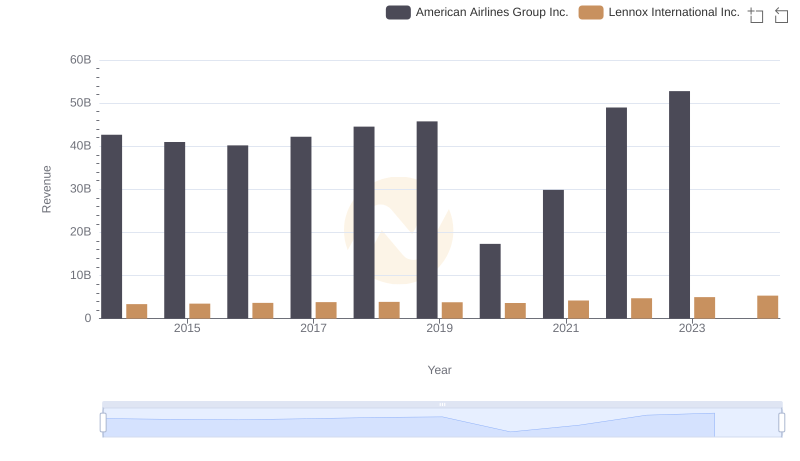
Revenue Showdown: Lennox International Inc. vs American Airlines Group Inc.
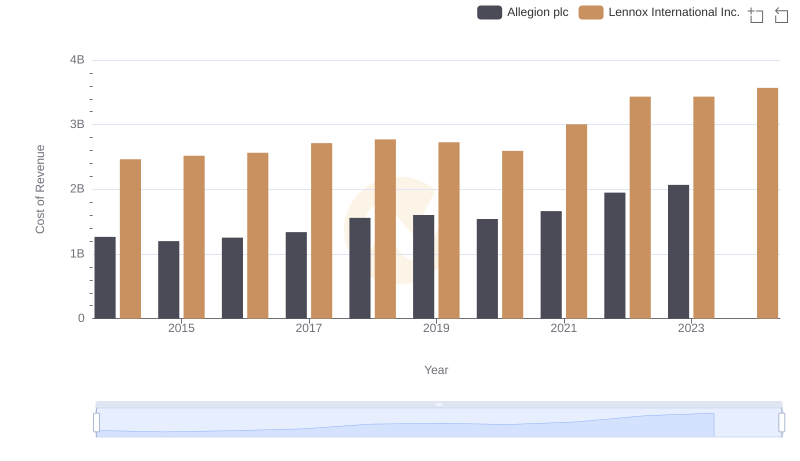
Analyzing Cost of Revenue: Lennox International Inc. and Allegion plc
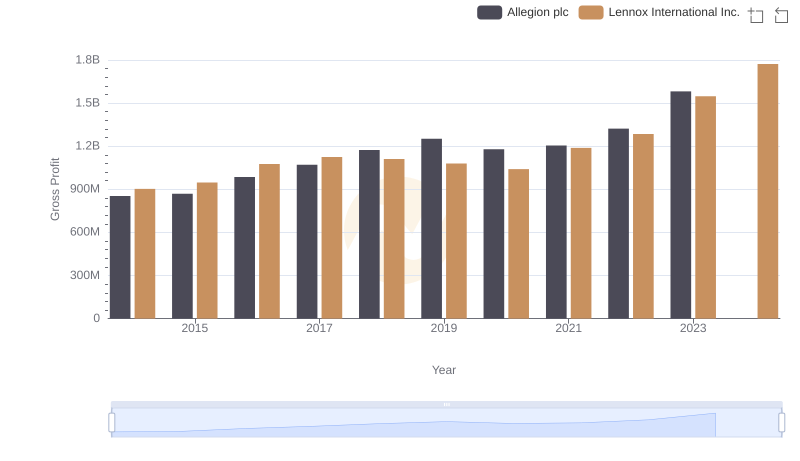
Key Insights on Gross Profit: Lennox International Inc. vs Allegion plc
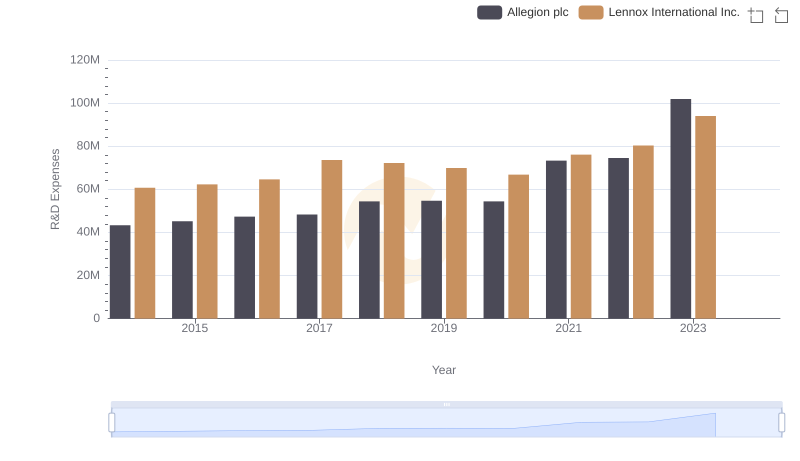
Research and Development: Comparing Key Metrics for Lennox International Inc. and Allegion plc
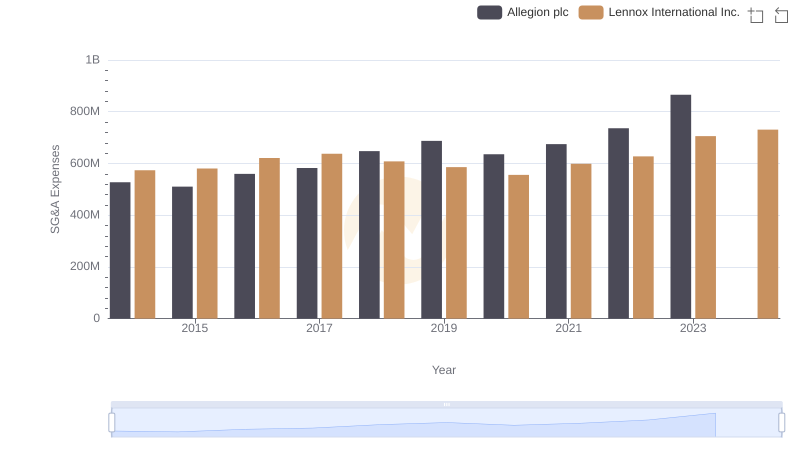
Who Optimizes SG&A Costs Better? Lennox International Inc. or Allegion plc
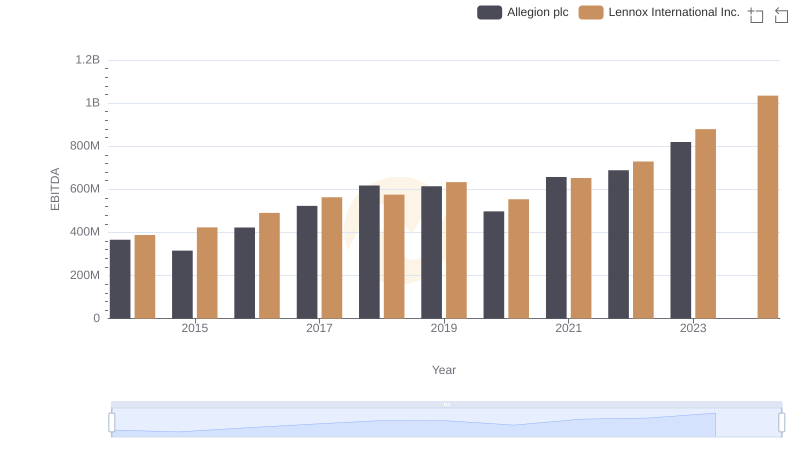
Professional EBITDA Benchmarking: Lennox International Inc. vs Allegion plc