| __timestamp | American Airlines Group Inc. | Lennox International Inc. |
|---|---|---|
| Wednesday, January 1, 2014 | 42650000000 | 3367400000 |
| Thursday, January 1, 2015 | 40990000000 | 3467400000 |
| Friday, January 1, 2016 | 40180000000 | 3641600000 |
| Sunday, January 1, 2017 | 42207000000 | 3839600000 |
| Monday, January 1, 2018 | 44541000000 | 3883900000 |
| Tuesday, January 1, 2019 | 45768000000 | 3807200000 |
| Wednesday, January 1, 2020 | 17337000000 | 3634100000 |
| Friday, January 1, 2021 | 29882000000 | 4194100000 |
| Saturday, January 1, 2022 | 48971000000 | 4718400000 |
| Sunday, January 1, 2023 | 52788000000 | 4981900000 |
| Monday, January 1, 2024 | 5341300000 |
Unleashing insights
In the ever-evolving landscape of American industry, Lennox International Inc. and American Airlines Group Inc. stand as titans in their respective fields. Over the past decade, these companies have showcased resilience and adaptability, with revenues reflecting their strategic maneuvers. From 2014 to 2023, American Airlines' revenue soared by approximately 24%, peaking in 2023 despite a significant dip in 2020 due to global disruptions. Meanwhile, Lennox International, a leader in climate control solutions, demonstrated steady growth, with a 48% increase in revenue over the same period. Notably, Lennox's revenue in 2023 was nearly 5 billion, marking a consistent upward trajectory. While American Airlines experienced a revenue resurgence post-2020, Lennox's growth remained unwavering, highlighting its robust market position. As we look to 2024, Lennox's data remains promising, while American Airlines' figures are yet to be unveiled, leaving room for anticipation.
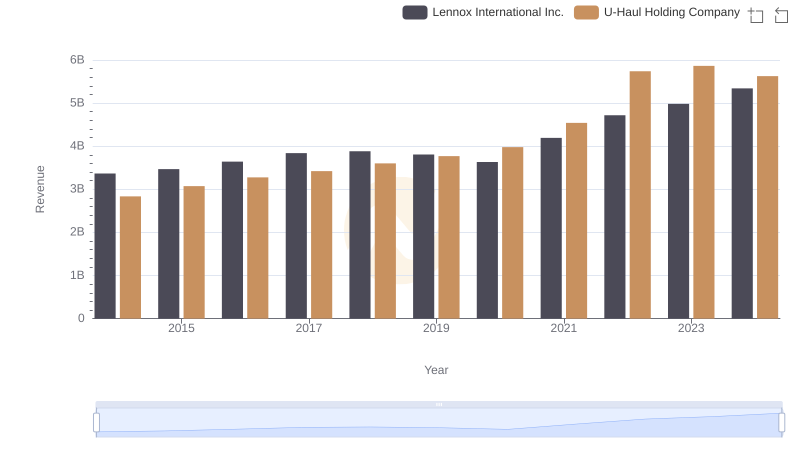
Lennox International Inc. and U-Haul Holding Company: A Comprehensive Revenue Analysis
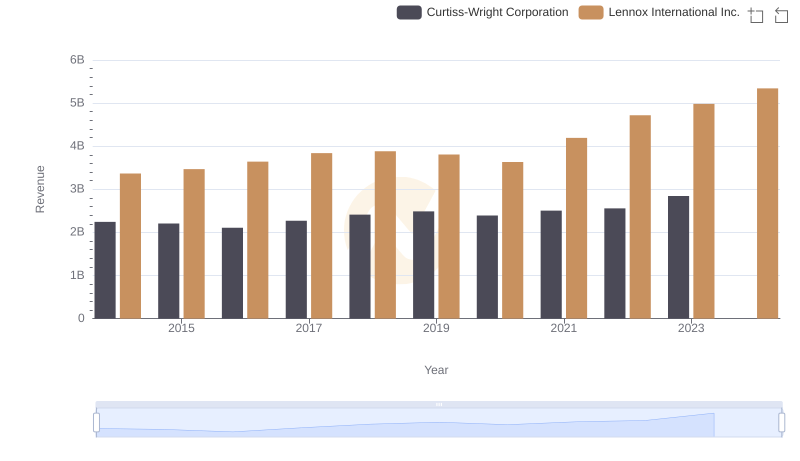
Revenue Showdown: Lennox International Inc. vs Curtiss-Wright Corporation
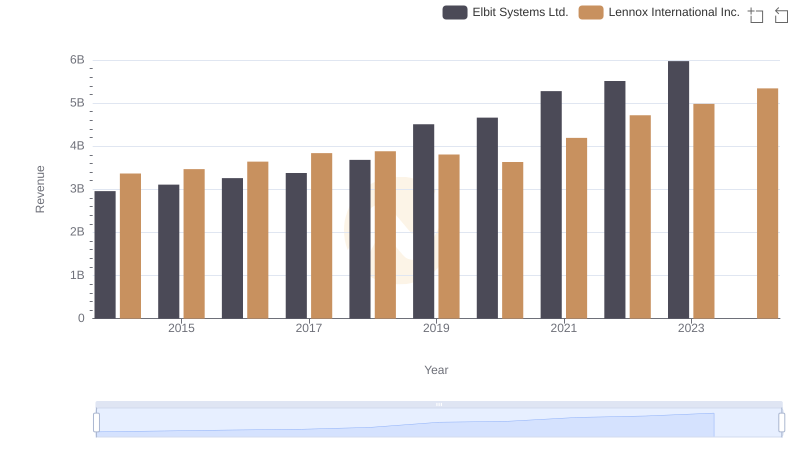
Lennox International Inc. or Elbit Systems Ltd.: Who Leads in Yearly Revenue?
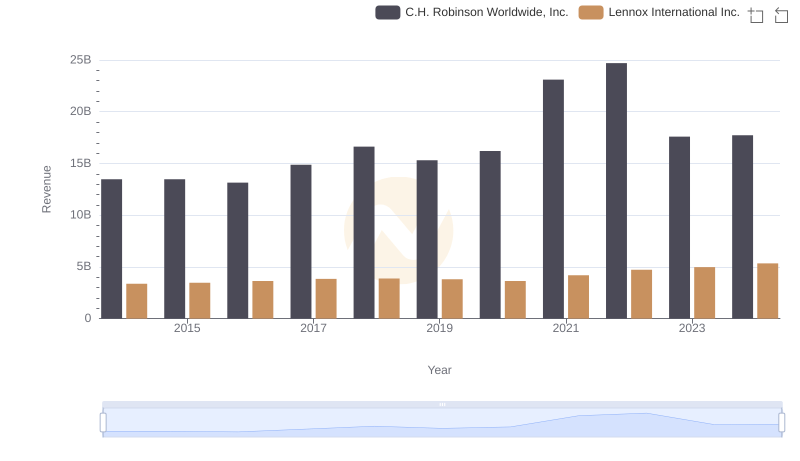
Revenue Showdown: Lennox International Inc. vs C.H. Robinson Worldwide, Inc.
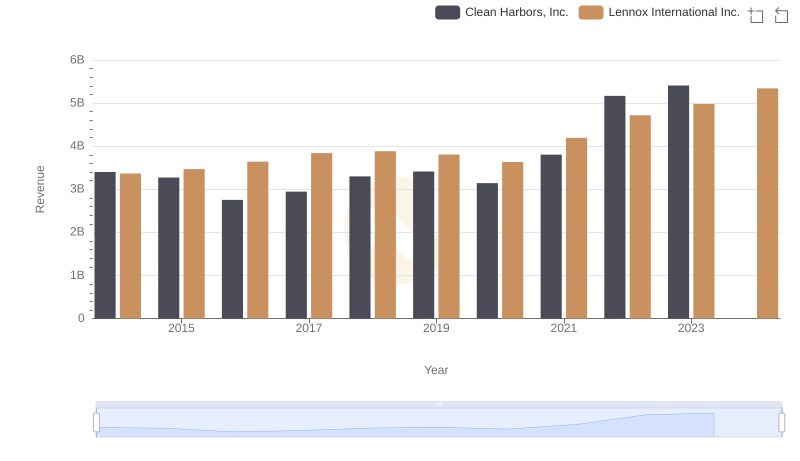
Comparing Revenue Performance: Lennox International Inc. or Clean Harbors, Inc.?
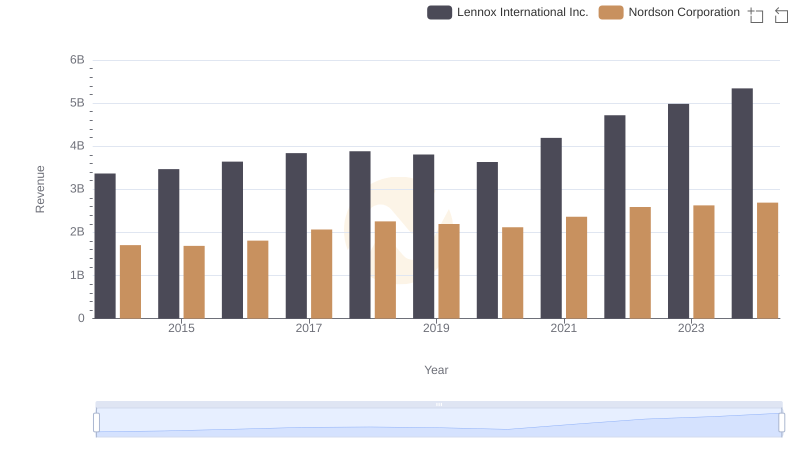
Revenue Showdown: Lennox International Inc. vs Nordson Corporation
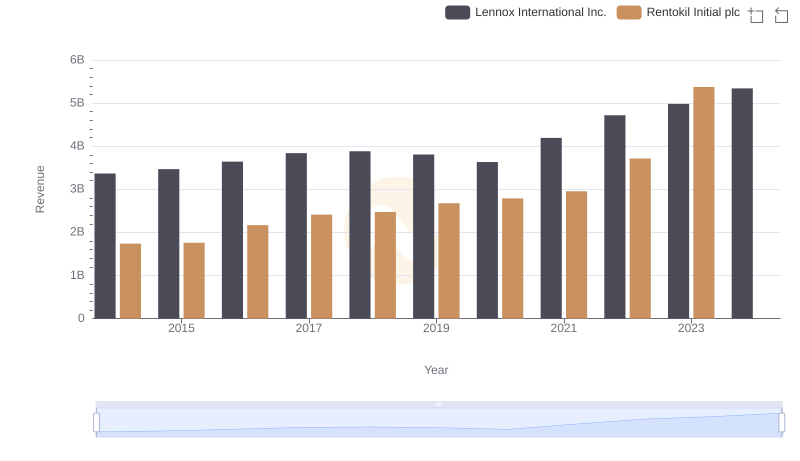
Annual Revenue Comparison: Lennox International Inc. vs Rentokil Initial plc
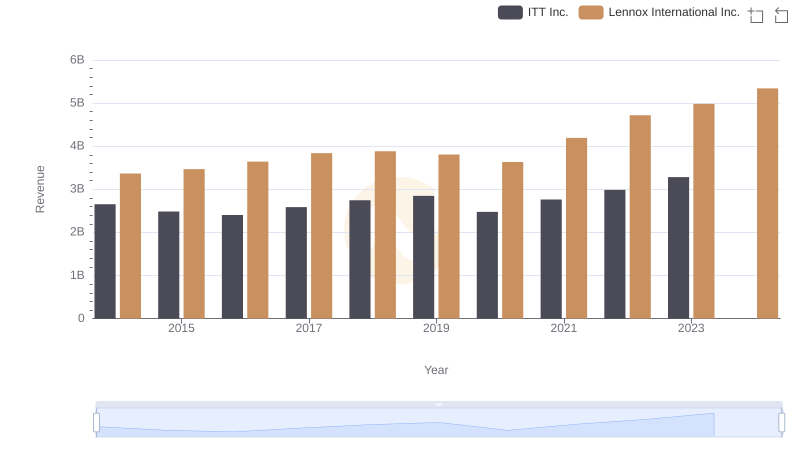
Annual Revenue Comparison: Lennox International Inc. vs ITT Inc.
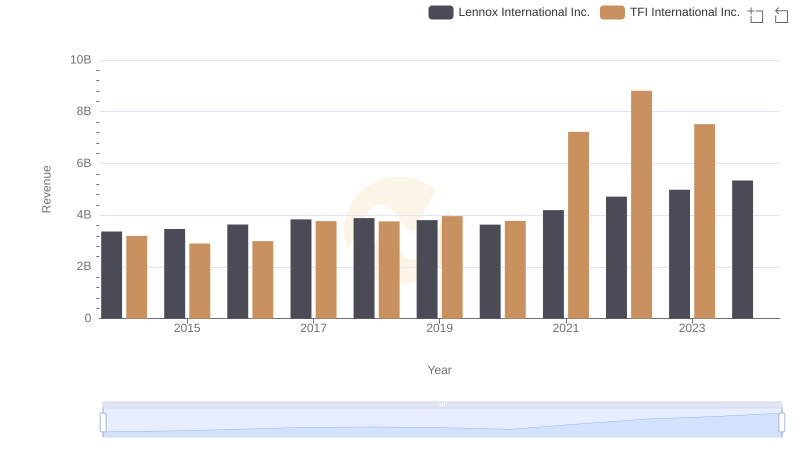
Lennox International Inc. and TFI International Inc.: A Comprehensive Revenue Analysis
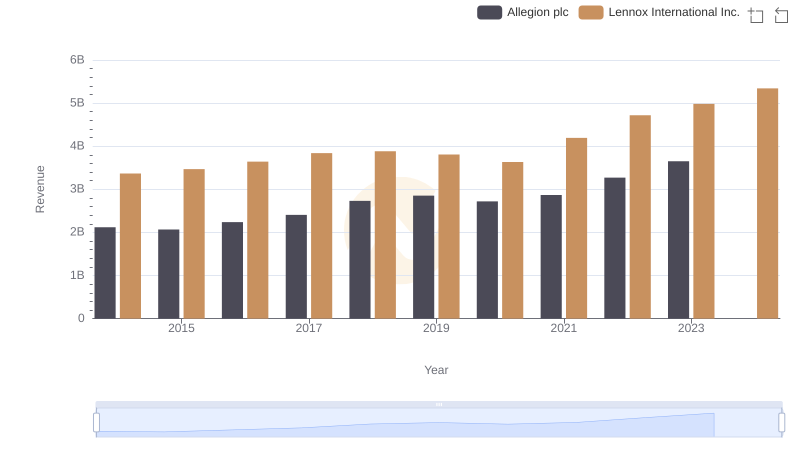
Annual Revenue Comparison: Lennox International Inc. vs Allegion plc
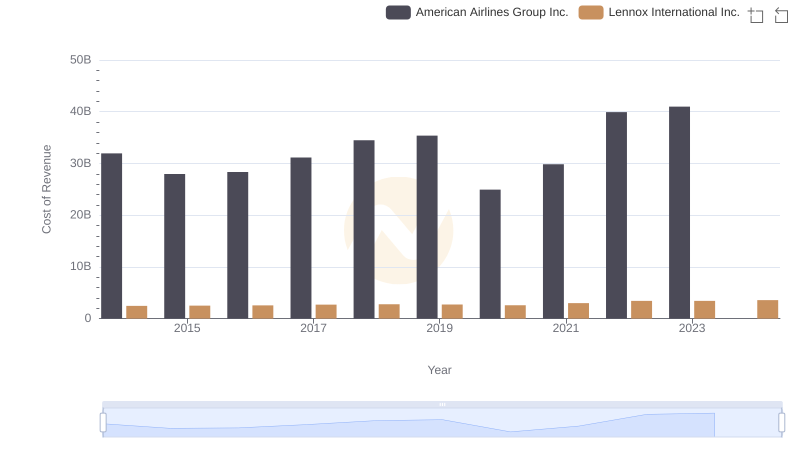
Comparing Cost of Revenue Efficiency: Lennox International Inc. vs American Airlines Group Inc.
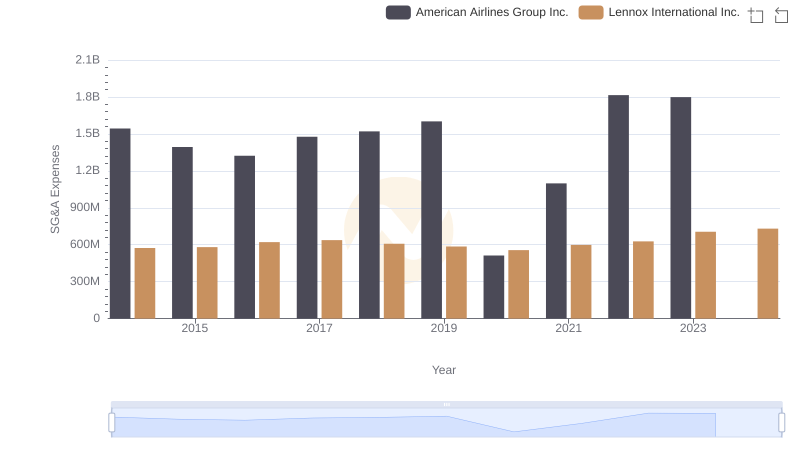
Lennox International Inc. and American Airlines Group Inc.: SG&A Spending Patterns Compared