| __timestamp | Lennox International Inc. | Rentokil Initial plc |
|---|---|---|
| Wednesday, January 1, 2014 | 3367400000 | 1740800000 |
| Thursday, January 1, 2015 | 3467400000 | 1759000000 |
| Friday, January 1, 2016 | 3641600000 | 2168100000 |
| Sunday, January 1, 2017 | 3839600000 | 2412300000 |
| Monday, January 1, 2018 | 3883900000 | 2472300000 |
| Tuesday, January 1, 2019 | 3807200000 | 2676200000 |
| Wednesday, January 1, 2020 | 3634100000 | 2789400000 |
| Friday, January 1, 2021 | 4194100000 | 2953900000 |
| Saturday, January 1, 2022 | 4718400000 | 3714000000 |
| Sunday, January 1, 2023 | 4981900000 | 5375000000 |
| Monday, January 1, 2024 | 5341300000 |
Unleashing the power of data
In the ever-evolving landscape of global business, Lennox International Inc. and Rentokil Initial plc have emerged as formidable players. Over the past decade, Lennox International has seen its revenue grow by approximately 59%, from $3.37 billion in 2014 to an impressive $5.34 billion in 2024. Meanwhile, Rentokil Initial plc has experienced a remarkable surge, with its revenue more than tripling from $1.74 billion in 2014 to $5.38 billion in 2023.
This growth trajectory highlights the resilience and adaptability of these companies in a competitive market. Notably, Rentokil's revenue leap in 2023 marks a significant milestone, surpassing Lennox for the first time in this period. As we look to the future, the absence of data for Rentokil in 2024 leaves us eagerly anticipating their next move in this dynamic industry.
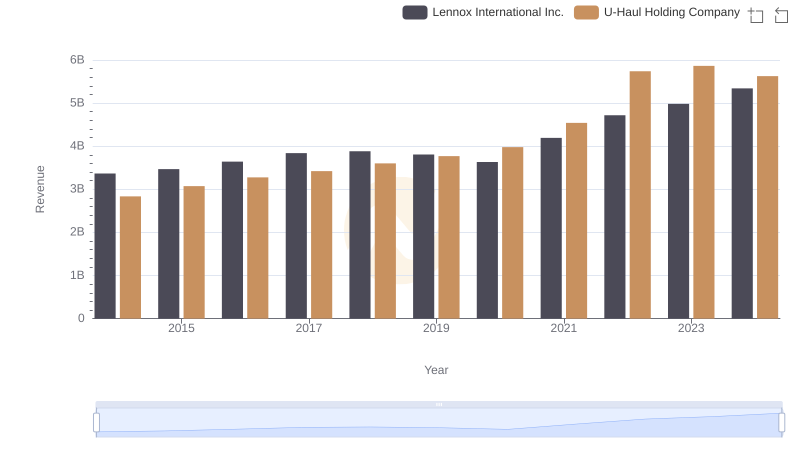
Lennox International Inc. and U-Haul Holding Company: A Comprehensive Revenue Analysis
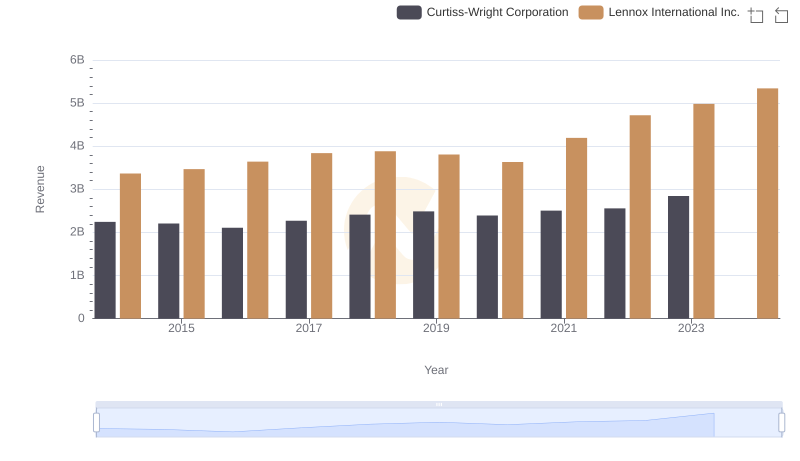
Revenue Showdown: Lennox International Inc. vs Curtiss-Wright Corporation
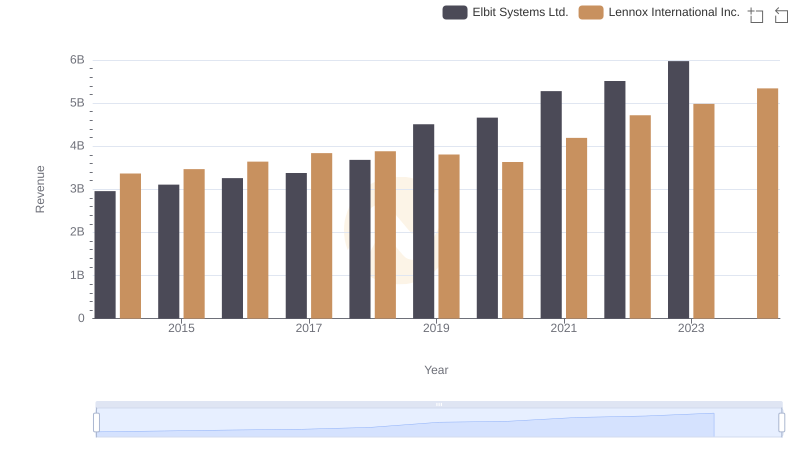
Lennox International Inc. or Elbit Systems Ltd.: Who Leads in Yearly Revenue?
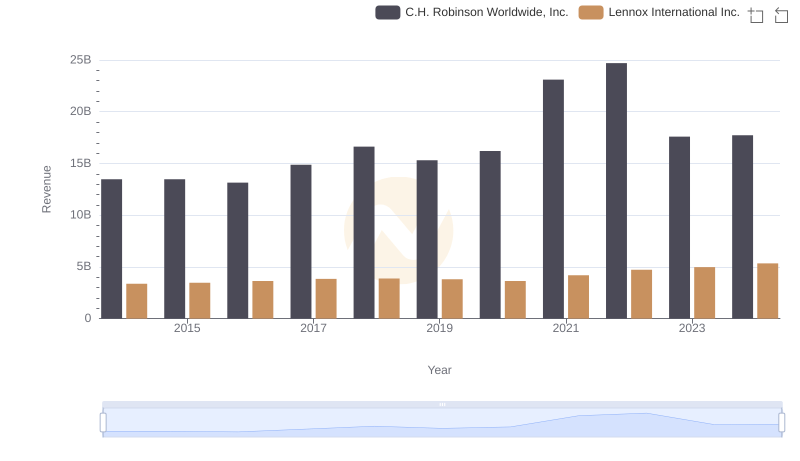
Revenue Showdown: Lennox International Inc. vs C.H. Robinson Worldwide, Inc.
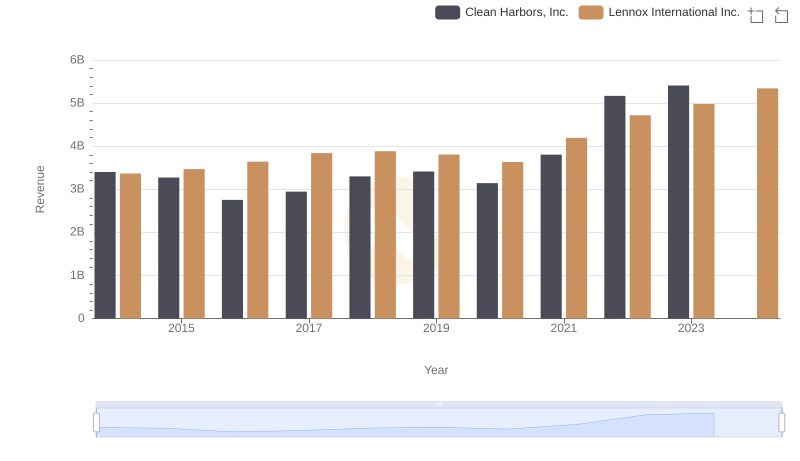
Comparing Revenue Performance: Lennox International Inc. or Clean Harbors, Inc.?
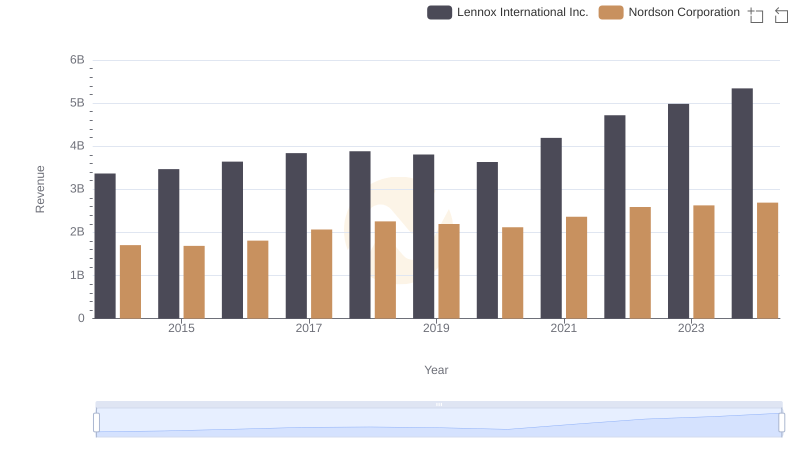
Revenue Showdown: Lennox International Inc. vs Nordson Corporation
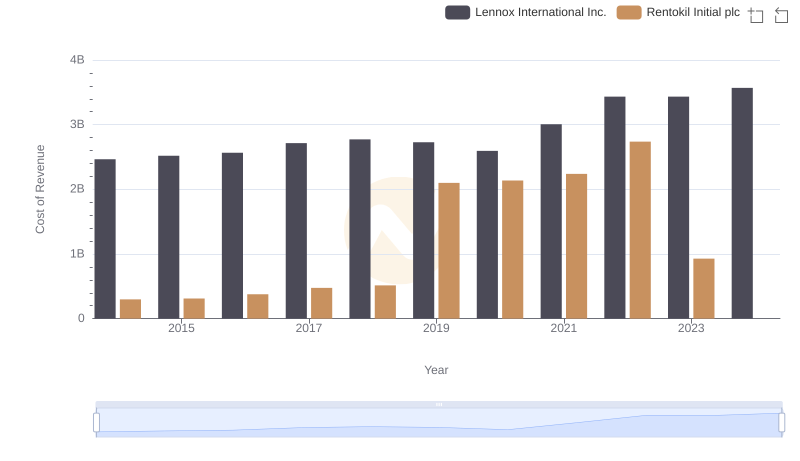
Cost Insights: Breaking Down Lennox International Inc. and Rentokil Initial plc's Expenses
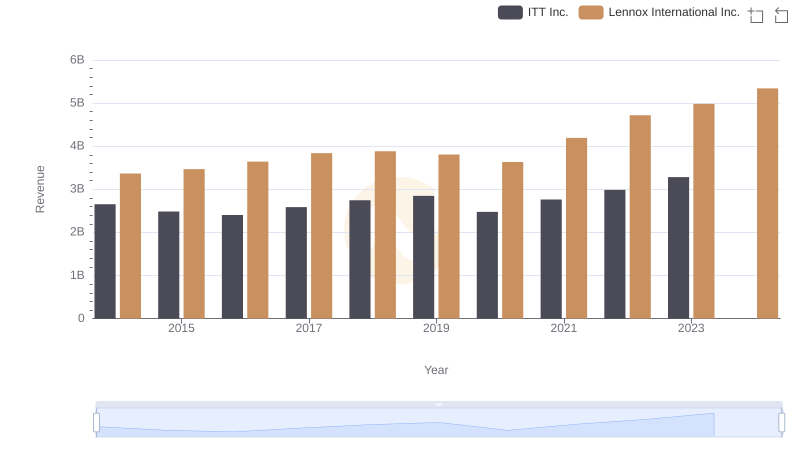
Annual Revenue Comparison: Lennox International Inc. vs ITT Inc.
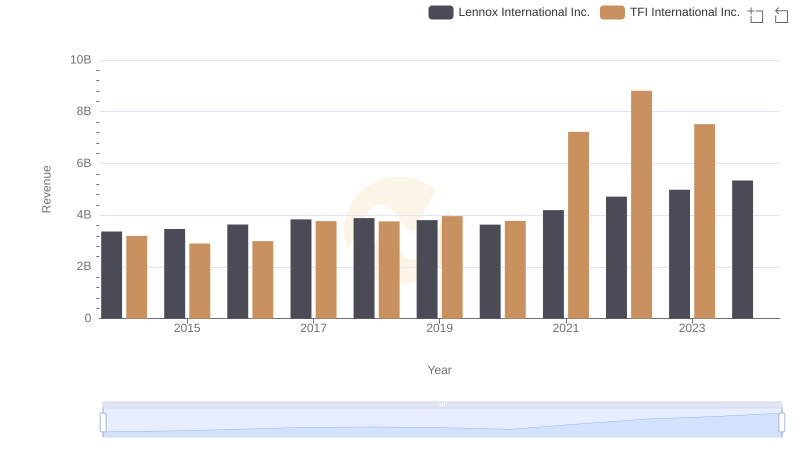
Lennox International Inc. and TFI International Inc.: A Comprehensive Revenue Analysis
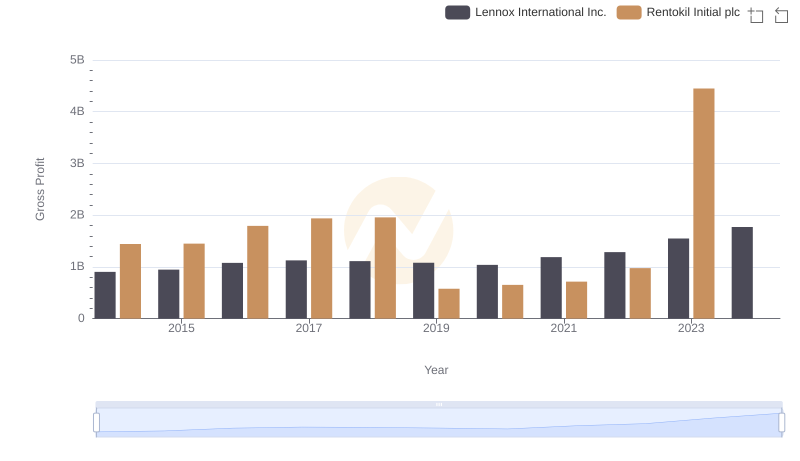
Gross Profit Comparison: Lennox International Inc. and Rentokil Initial plc Trends
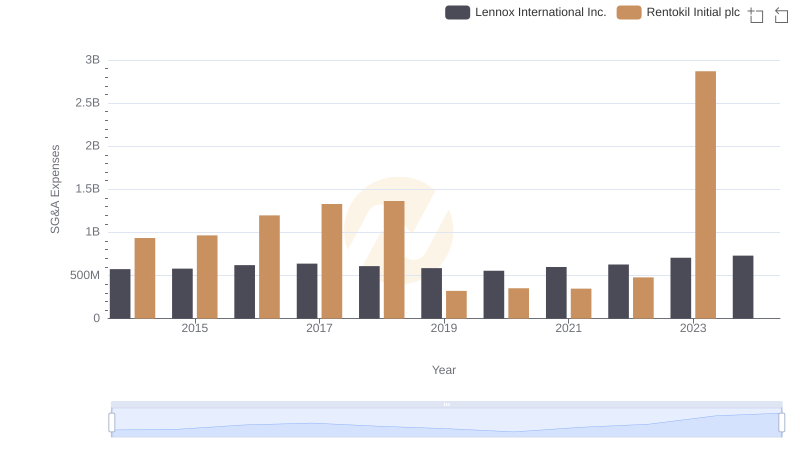
Who Optimizes SG&A Costs Better? Lennox International Inc. or Rentokil Initial plc
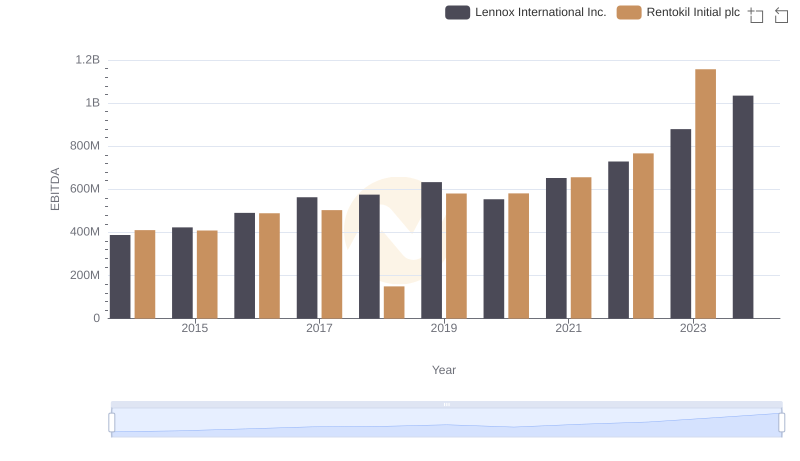
Lennox International Inc. vs Rentokil Initial plc: In-Depth EBITDA Performance Comparison