| __timestamp | Lennox International Inc. | Nordson Corporation |
|---|---|---|
| Wednesday, January 1, 2014 | 3367400000 | 1704021000 |
| Thursday, January 1, 2015 | 3467400000 | 1688666000 |
| Friday, January 1, 2016 | 3641600000 | 1808994000 |
| Sunday, January 1, 2017 | 3839600000 | 2066982000 |
| Monday, January 1, 2018 | 3883900000 | 2254668000 |
| Tuesday, January 1, 2019 | 3807200000 | 2194226000 |
| Wednesday, January 1, 2020 | 3634100000 | 2121100000 |
| Friday, January 1, 2021 | 4194100000 | 2362209000 |
| Saturday, January 1, 2022 | 4718400000 | 2590278000 |
| Sunday, January 1, 2023 | 4981900000 | 2628632000 |
| Monday, January 1, 2024 | 5341300000 | 2689921000 |
In pursuit of knowledge
In the competitive landscape of industrial manufacturing, Lennox International Inc. and Nordson Corporation have been key players. Over the past decade, Lennox International has consistently outperformed Nordson in terms of revenue growth. Starting in 2014, Lennox's revenue was approximately double that of Nordson's, and this trend has continued through 2024. By 2024, Lennox's revenue surged by nearly 59% from its 2014 figures, reaching over $5.3 billion, while Nordson's revenue increased by about 58% to nearly $2.7 billion.
This consistent growth highlights Lennox's strategic market positioning and operational efficiency. Meanwhile, Nordson's steady rise reflects its resilience and adaptability in a dynamic market. As both companies continue to innovate, investors and industry watchers will be keenly observing how these trends evolve in the coming years.
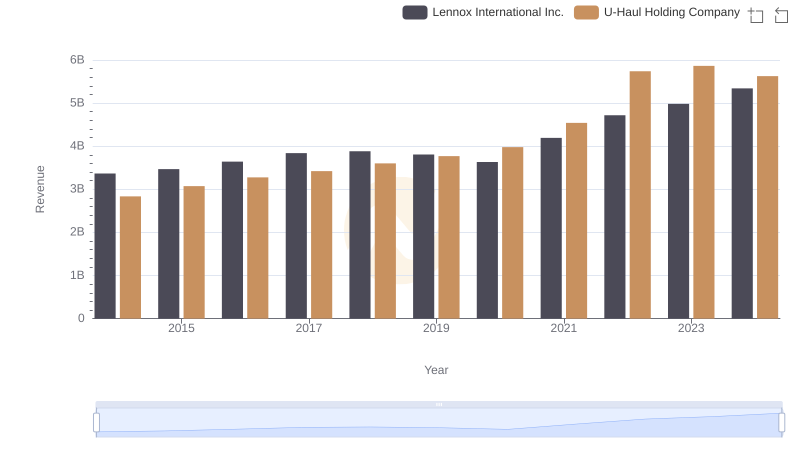
Lennox International Inc. and U-Haul Holding Company: A Comprehensive Revenue Analysis
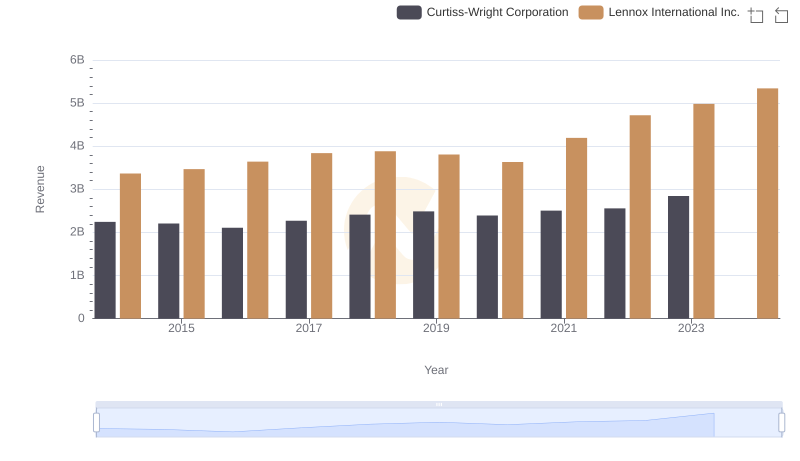
Revenue Showdown: Lennox International Inc. vs Curtiss-Wright Corporation
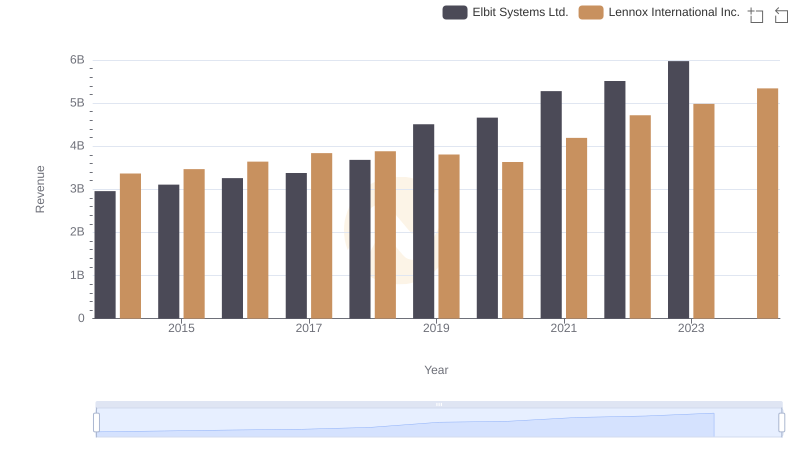
Lennox International Inc. or Elbit Systems Ltd.: Who Leads in Yearly Revenue?
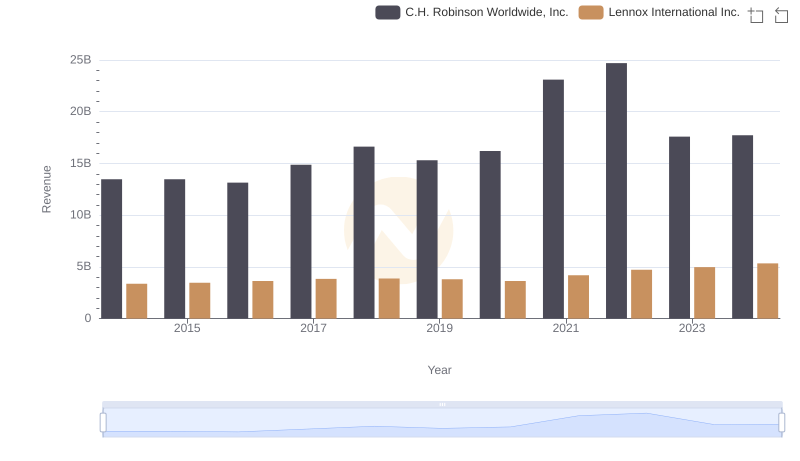
Revenue Showdown: Lennox International Inc. vs C.H. Robinson Worldwide, Inc.
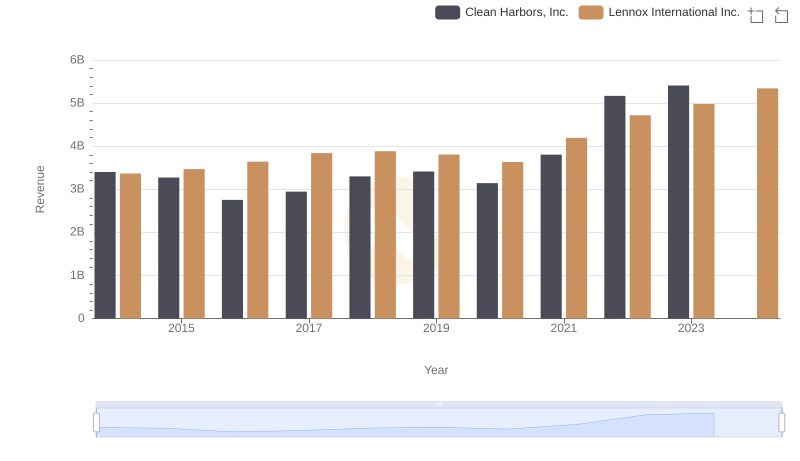
Comparing Revenue Performance: Lennox International Inc. or Clean Harbors, Inc.?
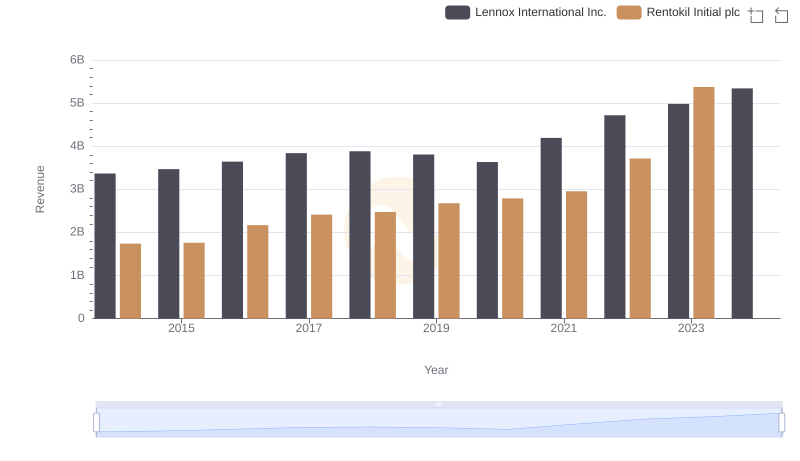
Annual Revenue Comparison: Lennox International Inc. vs Rentokil Initial plc
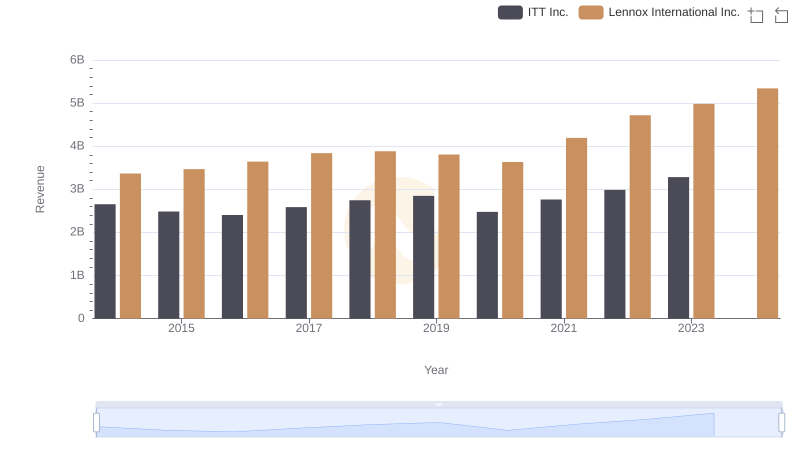
Annual Revenue Comparison: Lennox International Inc. vs ITT Inc.
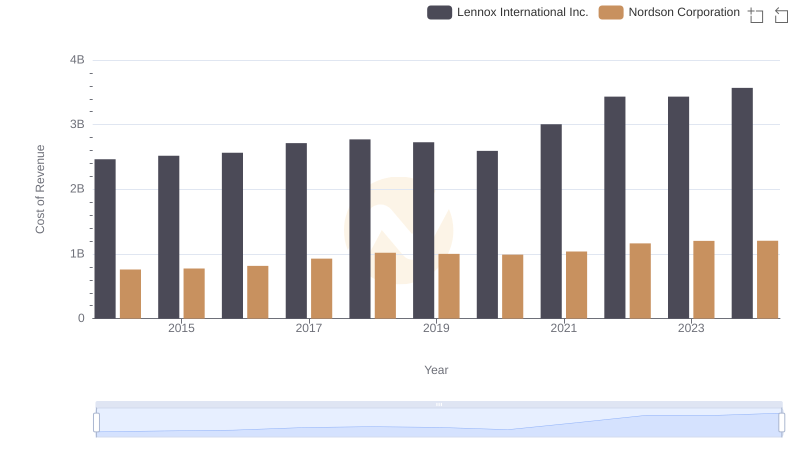
Cost of Revenue: Key Insights for Lennox International Inc. and Nordson Corporation
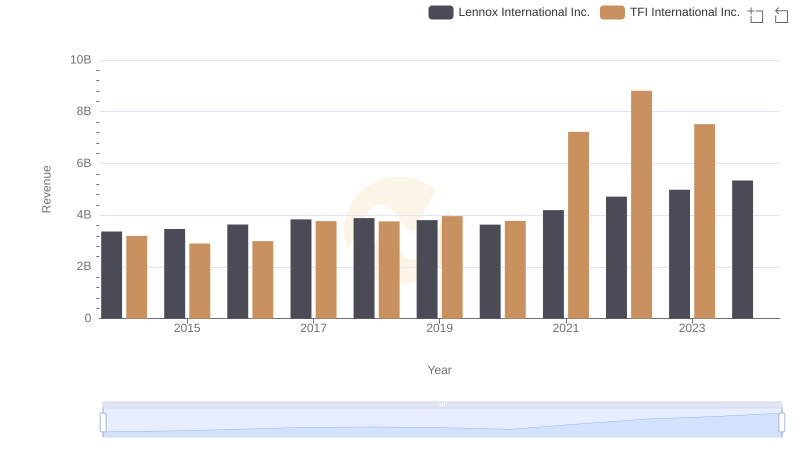
Lennox International Inc. and TFI International Inc.: A Comprehensive Revenue Analysis
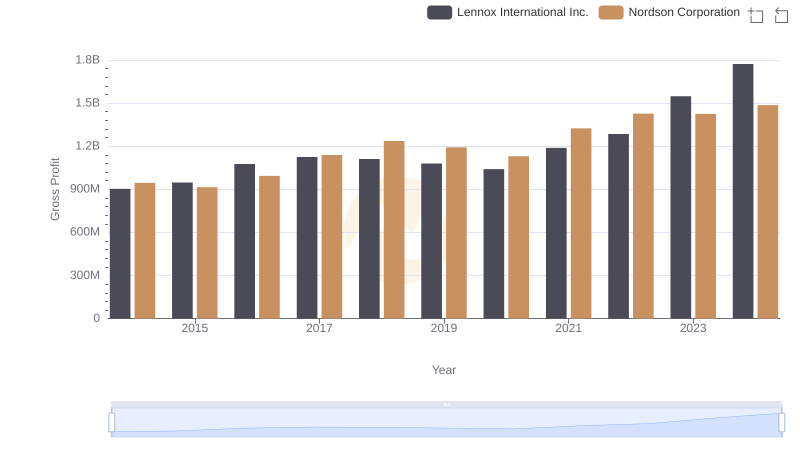
Gross Profit Trends Compared: Lennox International Inc. vs Nordson Corporation
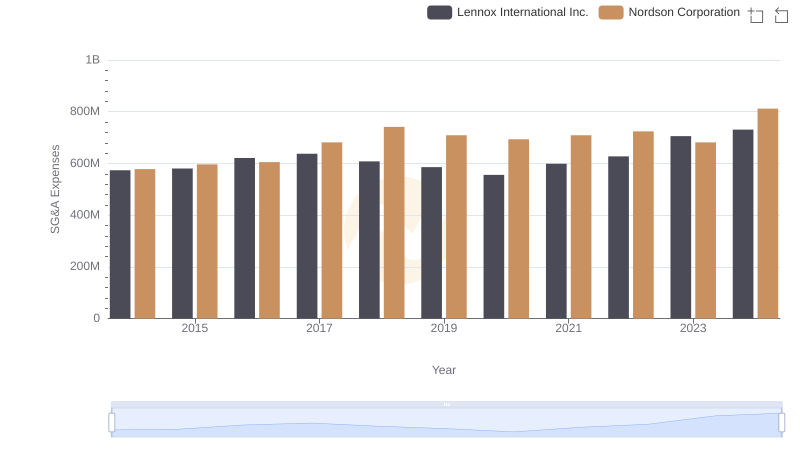
Breaking Down SG&A Expenses: Lennox International Inc. vs Nordson Corporation
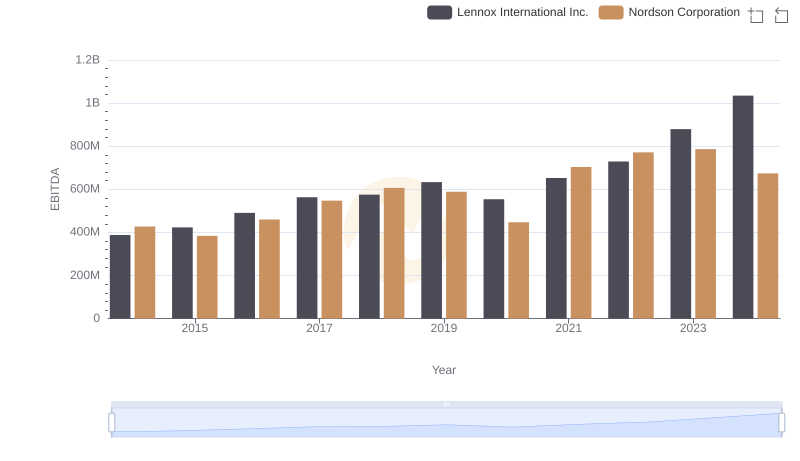
Lennox International Inc. vs Nordson Corporation: In-Depth EBITDA Performance Comparison