| __timestamp | International Business Machines Corporation | Motorola Solutions, Inc. |
|---|---|---|
| Wednesday, January 1, 2014 | 46407000000 | 2831000000 |
| Thursday, January 1, 2015 | 40684000000 | 2719000000 |
| Friday, January 1, 2016 | 38516000000 | 2869000000 |
| Sunday, January 1, 2017 | 36943000000 | 3024000000 |
| Monday, January 1, 2018 | 36936000000 | 3480000000 |
| Tuesday, January 1, 2019 | 31533000000 | 3931000000 |
| Wednesday, January 1, 2020 | 30865000000 | 3608000000 |
| Friday, January 1, 2021 | 31486000000 | 4040000000 |
| Saturday, January 1, 2022 | 32687000000 | 4229000000 |
| Sunday, January 1, 2023 | 34300000000 | 4970000000 |
| Monday, January 1, 2024 | 35551000000 | 5512000000 |
Cracking the code
In the ever-evolving landscape of technology giants, International Business Machines Corporation (IBM) and Motorola Solutions, Inc. have showcased intriguing gross profit trends over the past decade. From 2014 to 2023, IBM's gross profit has seen a notable decline of approximately 26%, starting from a peak in 2014. This trend reflects the company's strategic shifts and market challenges. Meanwhile, Motorola Solutions has demonstrated a more resilient trajectory, with a 75% increase in gross profit over the same period, highlighting its robust market positioning and growth strategies.
The data reveals a fascinating narrative of two industry leaders adapting to changing market dynamics. While IBM's gross profit dipped to its lowest in 2021, Motorola Solutions reached its highest in 2023. This comparison underscores the diverse strategies and market responses of these two iconic companies.
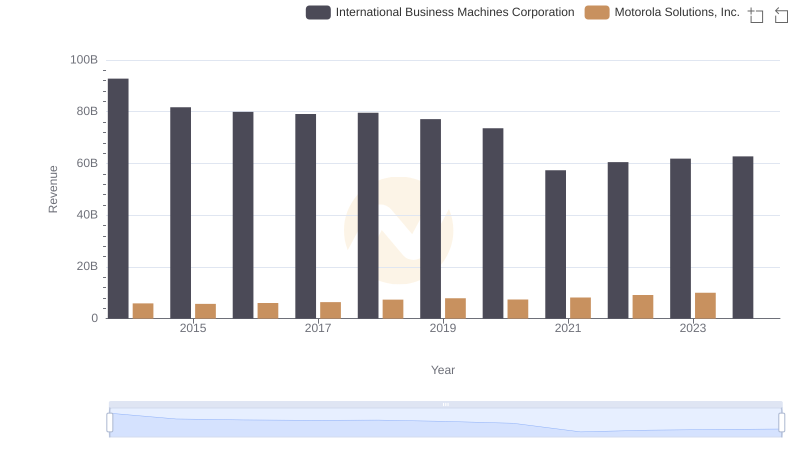
International Business Machines Corporation and Motorola Solutions, Inc.: A Comprehensive Revenue Analysis

Gross Profit Trends Compared: International Business Machines Corporation vs Marvell Technology, Inc.
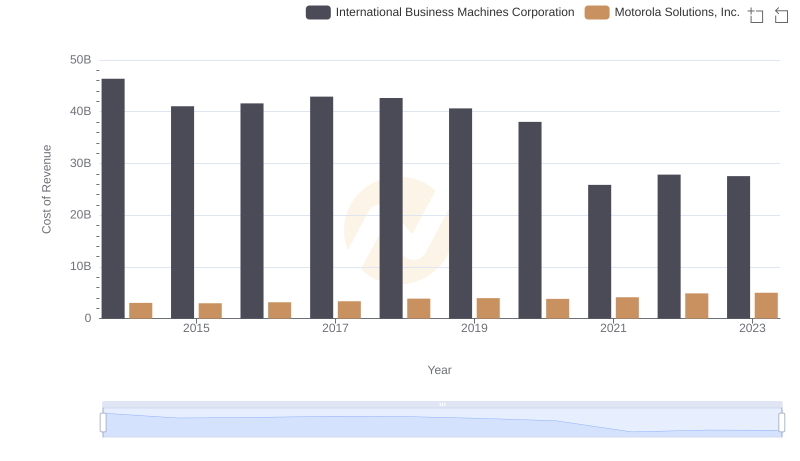
Analyzing Cost of Revenue: International Business Machines Corporation and Motorola Solutions, Inc.
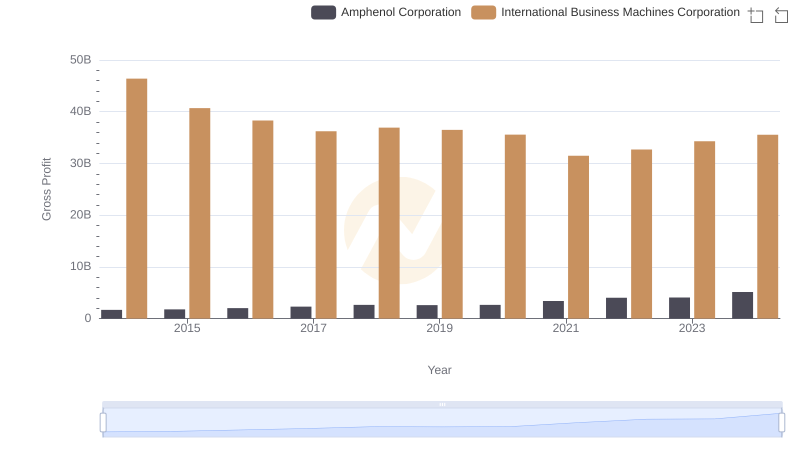
Who Generates Higher Gross Profit? International Business Machines Corporation or Amphenol Corporation
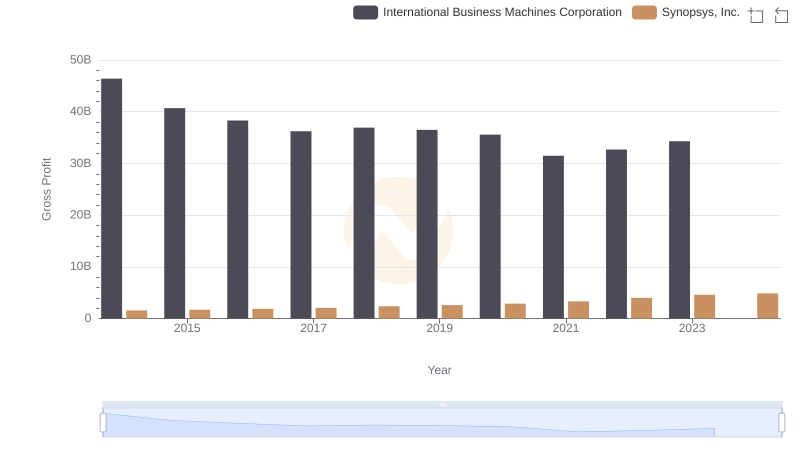
Key Insights on Gross Profit: International Business Machines Corporation vs Synopsys, Inc.
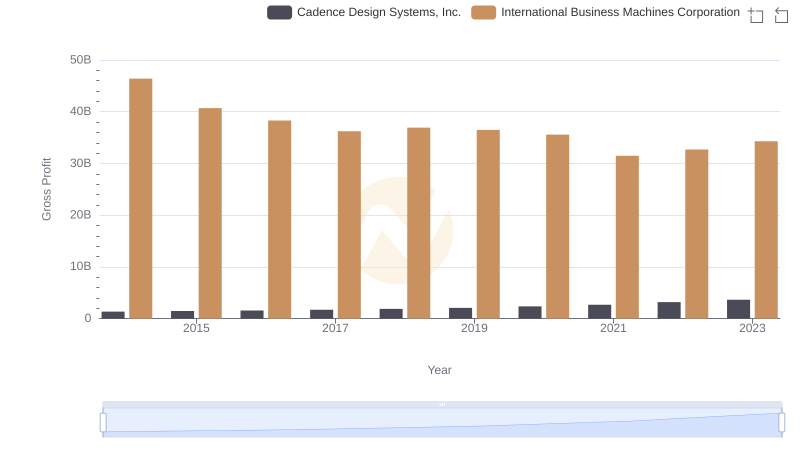
Gross Profit Analysis: Comparing International Business Machines Corporation and Cadence Design Systems, Inc.
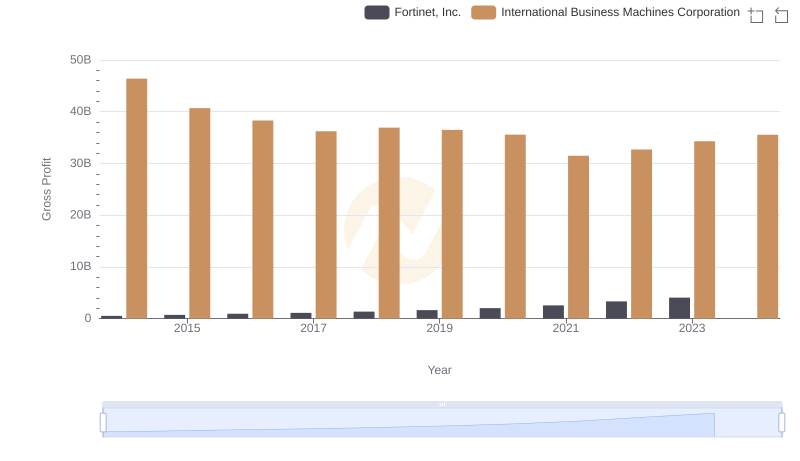
Who Generates Higher Gross Profit? International Business Machines Corporation or Fortinet, Inc.
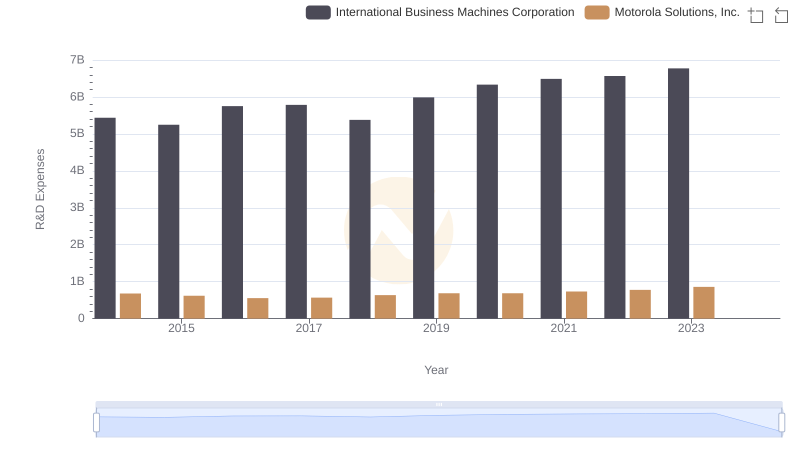
Comparing Innovation Spending: International Business Machines Corporation and Motorola Solutions, Inc.
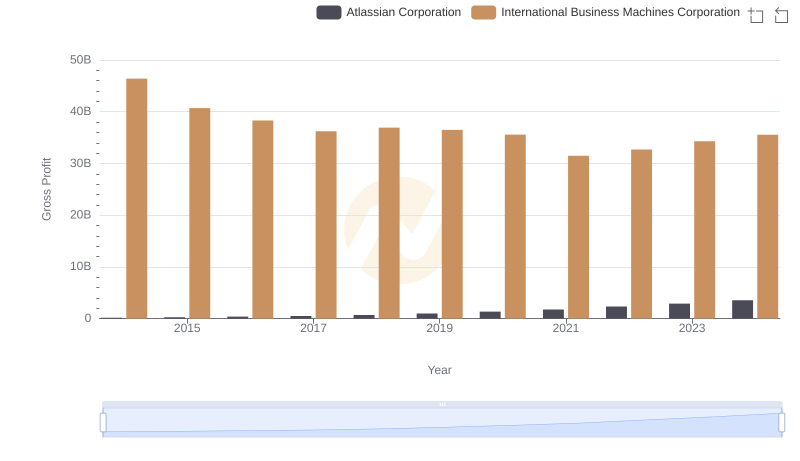
Gross Profit Comparison: International Business Machines Corporation and Atlassian Corporation Trends
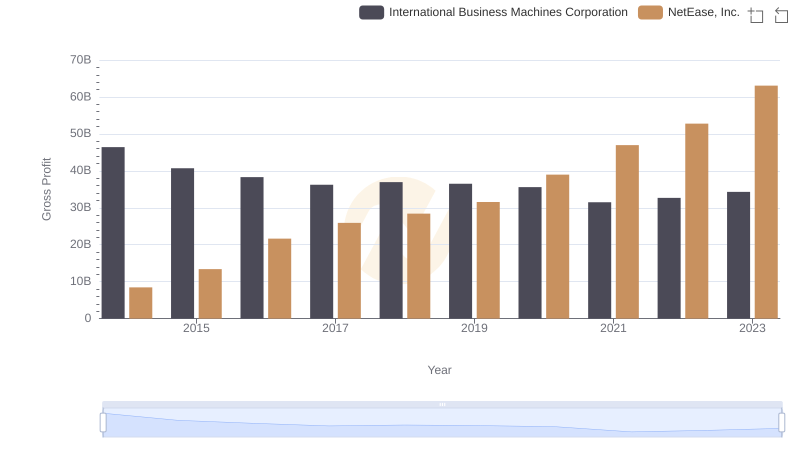
Gross Profit Analysis: Comparing International Business Machines Corporation and NetEase, Inc.
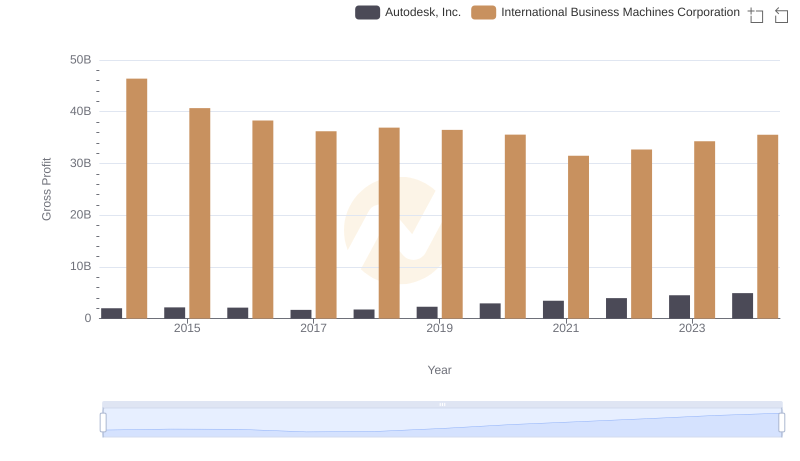
Key Insights on Gross Profit: International Business Machines Corporation vs Autodesk, Inc.
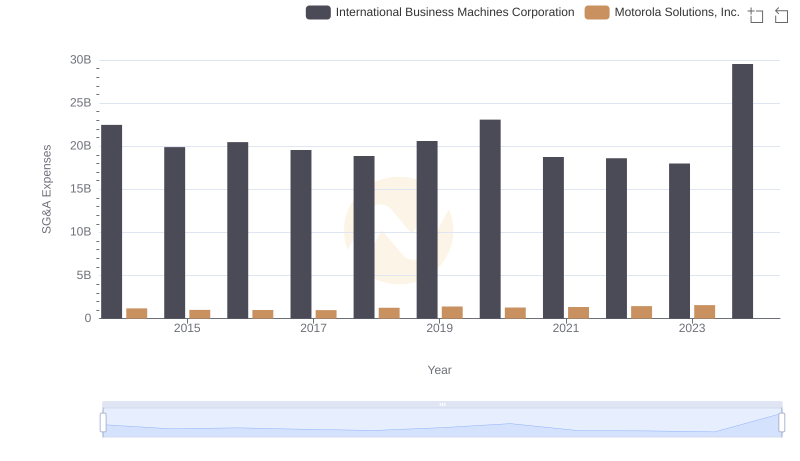
Cost Management Insights: SG&A Expenses for International Business Machines Corporation and Motorola Solutions, Inc.