| __timestamp | International Business Machines Corporation | MicroStrategy Incorporated |
|---|---|---|
| Wednesday, January 1, 2014 | 46407000000 | 444620000 |
| Thursday, January 1, 2015 | 40684000000 | 428761000 |
| Friday, January 1, 2016 | 38516000000 | 419014000 |
| Sunday, January 1, 2017 | 36943000000 | 407894000 |
| Monday, January 1, 2018 | 36936000000 | 398139000 |
| Tuesday, January 1, 2019 | 31533000000 | 386353000 |
| Wednesday, January 1, 2020 | 30865000000 | 389680000 |
| Friday, January 1, 2021 | 31486000000 | 418853000 |
| Saturday, January 1, 2022 | 32687000000 | 396275000 |
| Sunday, January 1, 2023 | 34300000000 | 386317000 |
| Monday, January 1, 2024 | 35551000000 | 333988000 |
Igniting the spark of knowledge
In the ever-evolving landscape of technology, the financial performance of industry titans like International Business Machines Corporation (IBM) and MicroStrategy Incorporated offers a fascinating glimpse into their strategic maneuvers. Over the past decade, IBM's gross profit has seen a notable decline, dropping from a peak in 2014 to a more modest figure in 2023. This represents a decrease of approximately 26%, reflecting the company's ongoing transformation and adaptation to new market demands.
Conversely, MicroStrategy's gross profit has remained relatively stable, with minor fluctuations over the same period. Despite its smaller scale, MicroStrategy's ability to maintain consistent profitability highlights its niche strength in business intelligence and analytics.
As we look to the future, the absence of data for 2024 suggests potential shifts on the horizon. Will IBM's strategic pivots pay off, or will MicroStrategy continue to hold its ground? Only time will tell.
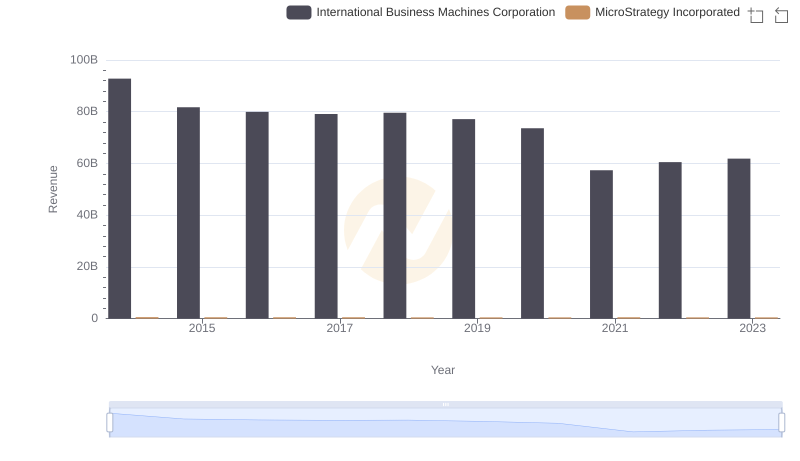
Revenue Insights: International Business Machines Corporation and MicroStrategy Incorporated Performance Compared
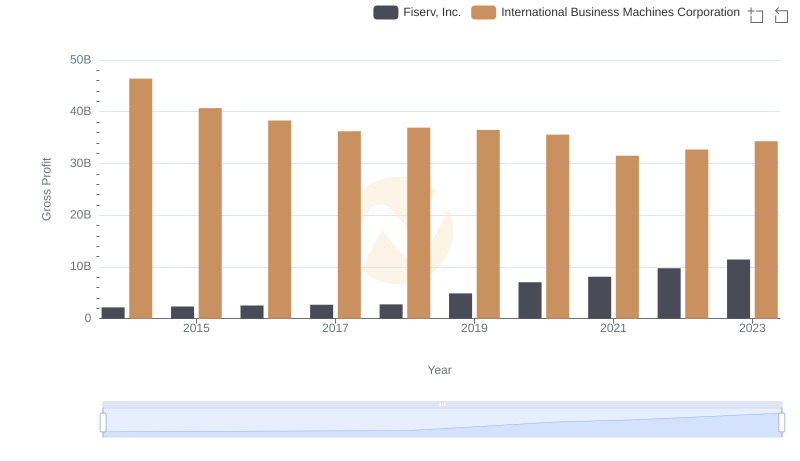
Key Insights on Gross Profit: International Business Machines Corporation vs Fiserv, Inc.
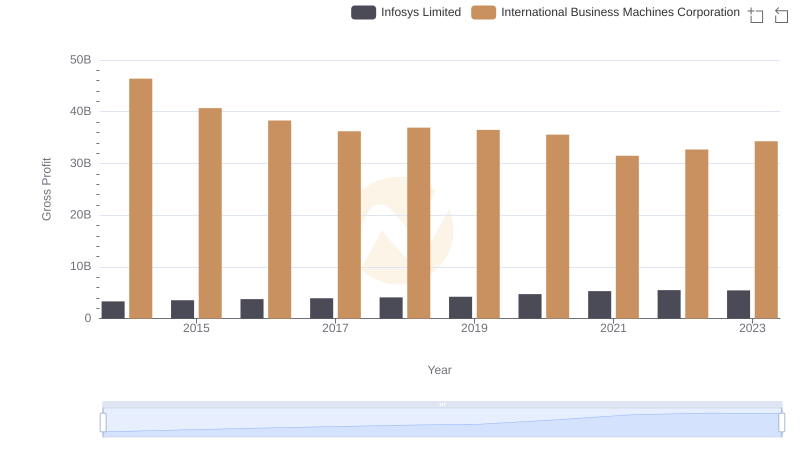
Key Insights on Gross Profit: International Business Machines Corporation vs Infosys Limited
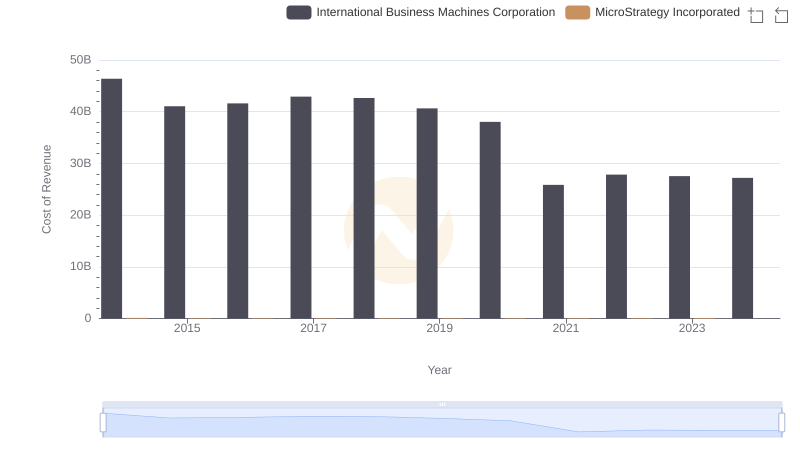
Cost of Revenue: Key Insights for International Business Machines Corporation and MicroStrategy Incorporated

Gross Profit Analysis: Comparing International Business Machines Corporation and Intel Corporation
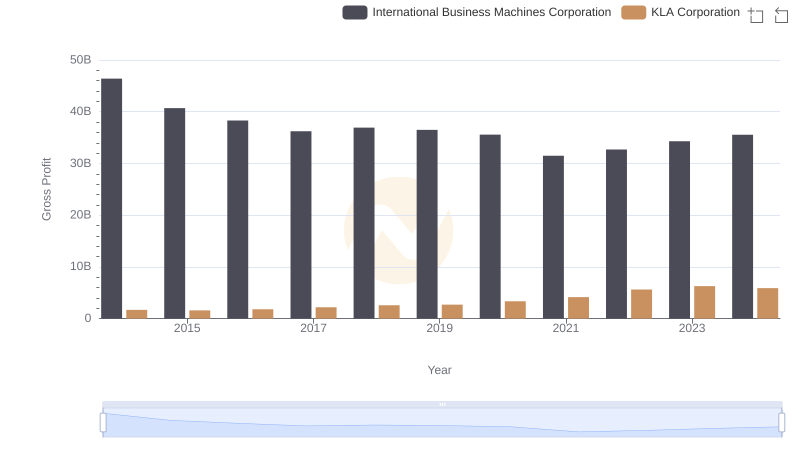
International Business Machines Corporation vs KLA Corporation: A Gross Profit Performance Breakdown

Gross Profit Trends Compared: International Business Machines Corporation vs Marvell Technology, Inc.
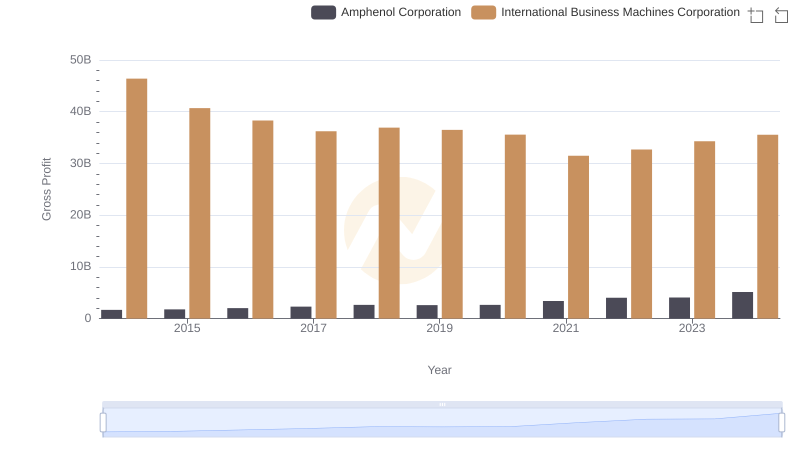
Who Generates Higher Gross Profit? International Business Machines Corporation or Amphenol Corporation
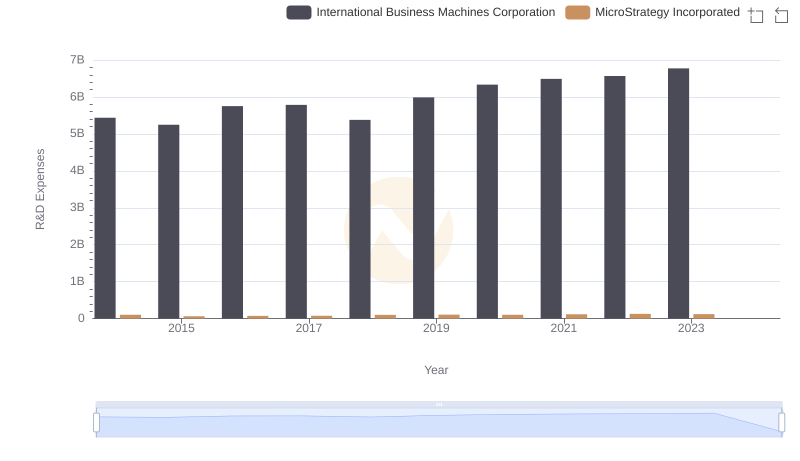
R&D Spending Showdown: International Business Machines Corporation vs MicroStrategy Incorporated
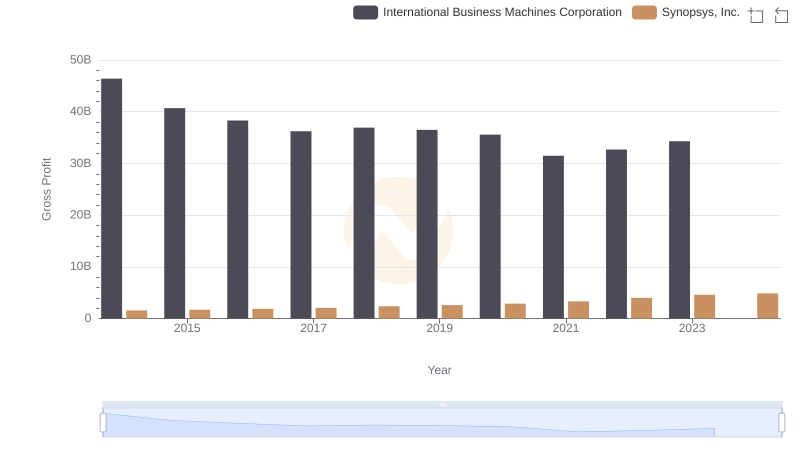
Key Insights on Gross Profit: International Business Machines Corporation vs Synopsys, Inc.
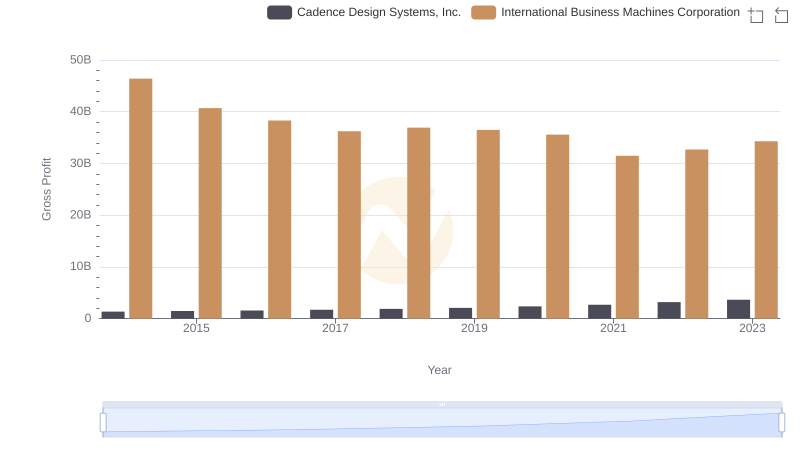
Gross Profit Analysis: Comparing International Business Machines Corporation and Cadence Design Systems, Inc.
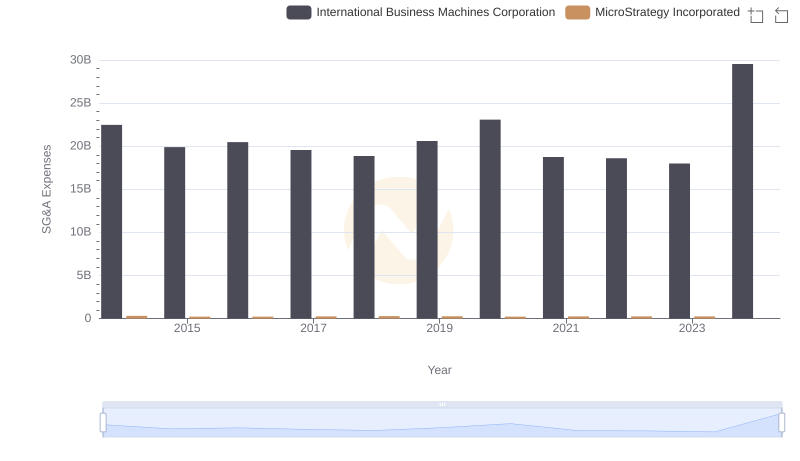
International Business Machines Corporation or MicroStrategy Incorporated: Who Manages SG&A Costs Better?