| __timestamp | Cadence Design Systems, Inc. | International Business Machines Corporation |
|---|---|---|
| Wednesday, January 1, 2014 | 1357226000 | 46407000000 |
| Thursday, January 1, 2015 | 1463638000 | 40684000000 |
| Friday, January 1, 2016 | 1559591000 | 38516000000 |
| Sunday, January 1, 2017 | 1705642000 | 36943000000 |
| Monday, January 1, 2018 | 1879275000 | 36936000000 |
| Tuesday, January 1, 2019 | 2069962000 | 31533000000 |
| Wednesday, January 1, 2020 | 2377393000 | 30865000000 |
| Friday, January 1, 2021 | 2681238000 | 31486000000 |
| Saturday, January 1, 2022 | 3190095000 | 32687000000 |
| Sunday, January 1, 2023 | 3654945000 | 34300000000 |
| Monday, January 1, 2024 | 4430362000 | 35551000000 |
Unlocking the unknown
In the ever-evolving landscape of technology, the financial performance of industry giants like International Business Machines Corporation (IBM) and Cadence Design Systems, Inc. offers a fascinating glimpse into their strategic prowess. Over the past decade, IBM's gross profit has shown a steady decline, dropping from a peak in 2014 to a more modest figure in 2023. This represents a decrease of approximately 26% over the period. In contrast, Cadence Design Systems has experienced a remarkable growth trajectory, with its gross profit more than doubling from 2014 to 2023, reflecting a robust 169% increase.
This divergence highlights the shifting dynamics within the tech industry, where nimble, innovative companies like Cadence are gaining ground against traditional behemoths like IBM. As we look to the future, these trends underscore the importance of adaptability and innovation in maintaining competitive advantage in the global market.
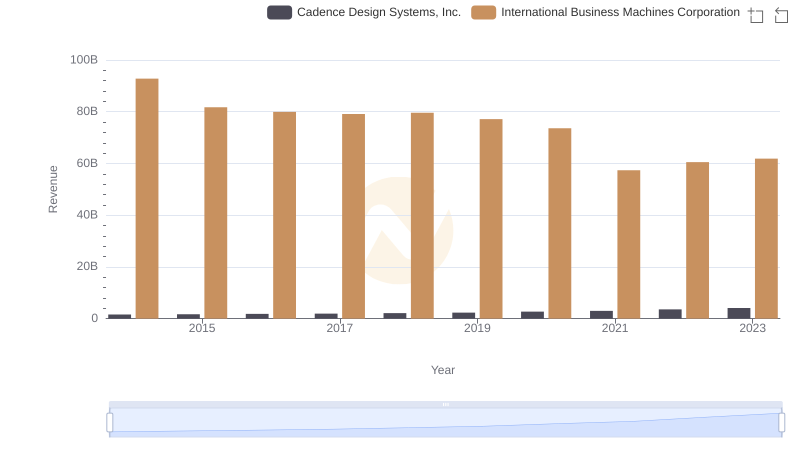
International Business Machines Corporation or Cadence Design Systems, Inc.: Who Leads in Yearly Revenue?
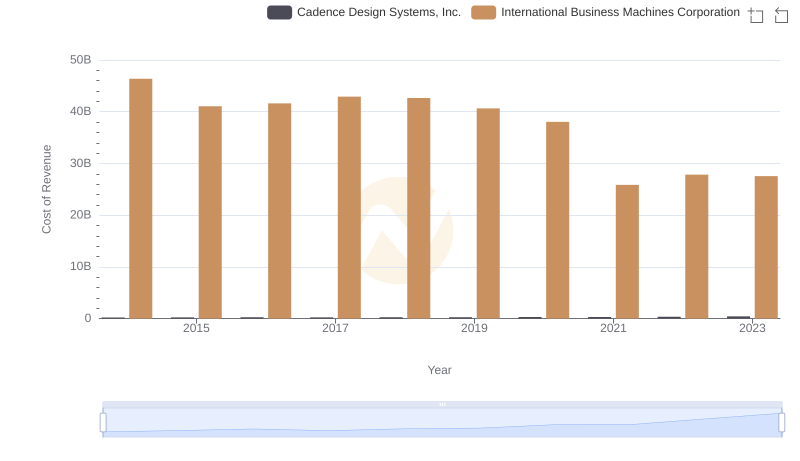
Cost of Revenue Comparison: International Business Machines Corporation vs Cadence Design Systems, Inc.
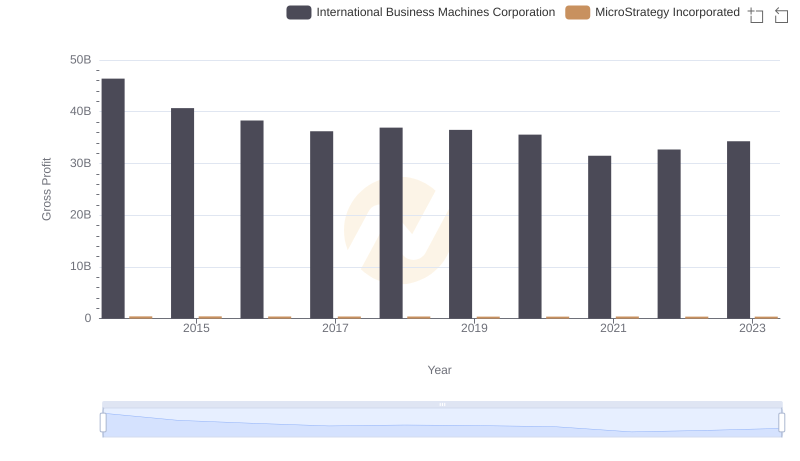
International Business Machines Corporation vs MicroStrategy Incorporated: A Gross Profit Performance Breakdown

Gross Profit Trends Compared: International Business Machines Corporation vs Marvell Technology, Inc.
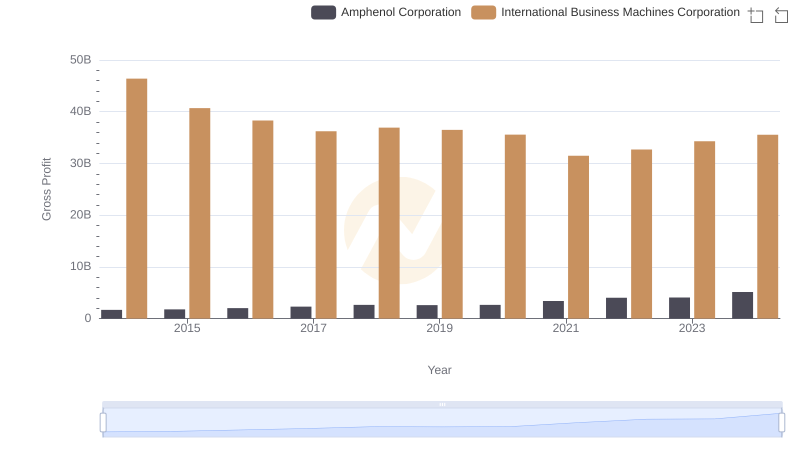
Who Generates Higher Gross Profit? International Business Machines Corporation or Amphenol Corporation
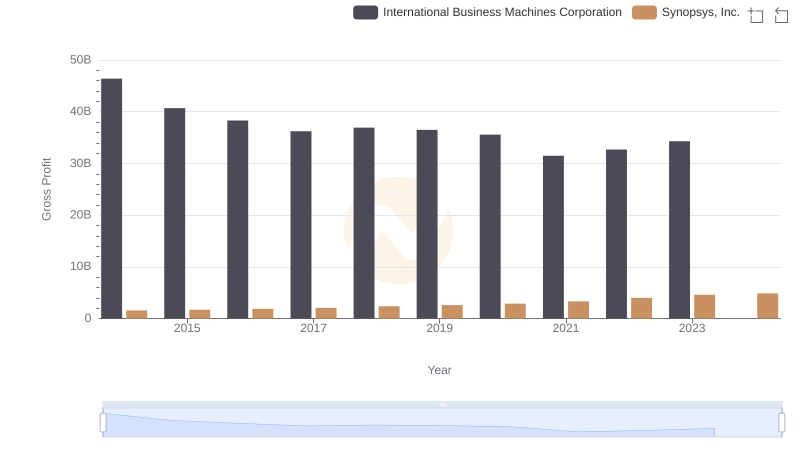
Key Insights on Gross Profit: International Business Machines Corporation vs Synopsys, Inc.
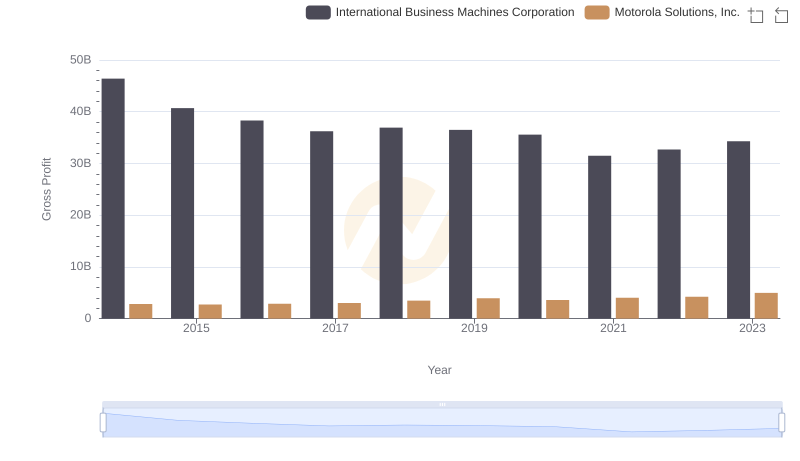
Gross Profit Trends Compared: International Business Machines Corporation vs Motorola Solutions, Inc.
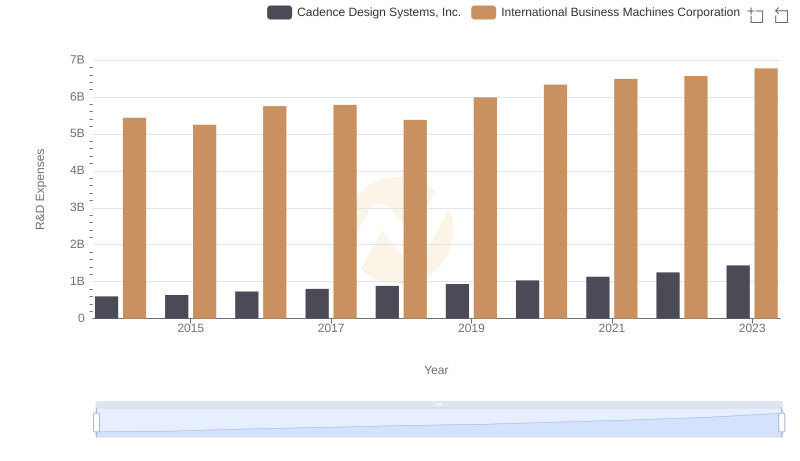
International Business Machines Corporation or Cadence Design Systems, Inc.: Who Invests More in Innovation?
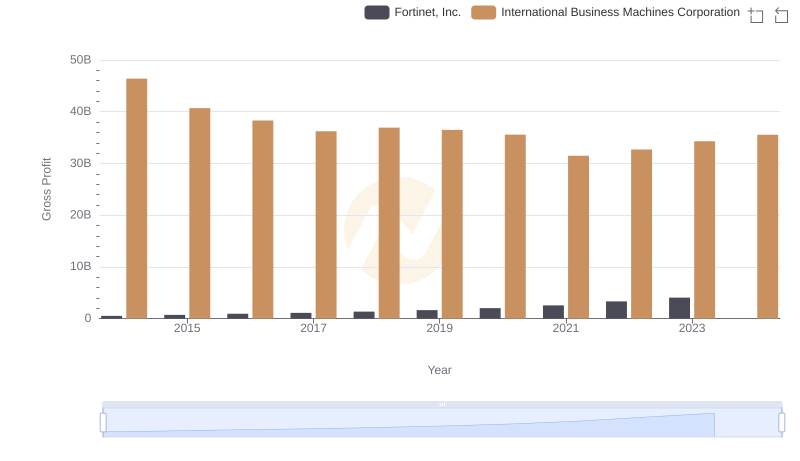
Who Generates Higher Gross Profit? International Business Machines Corporation or Fortinet, Inc.
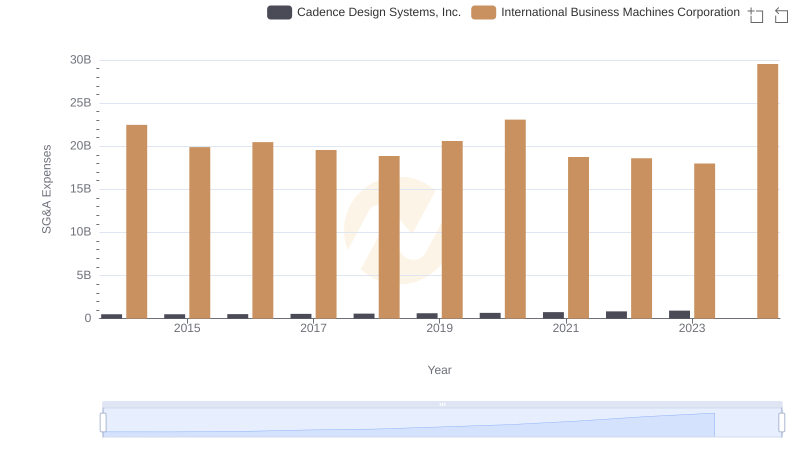
Cost Management Insights: SG&A Expenses for International Business Machines Corporation and Cadence Design Systems, Inc.
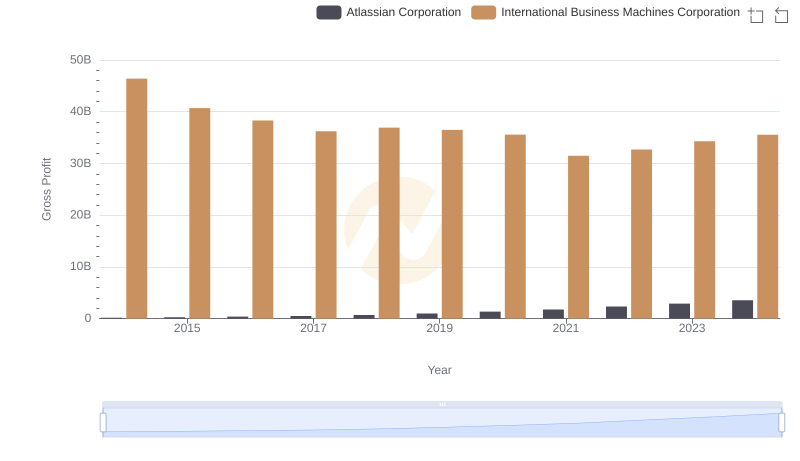
Gross Profit Comparison: International Business Machines Corporation and Atlassian Corporation Trends
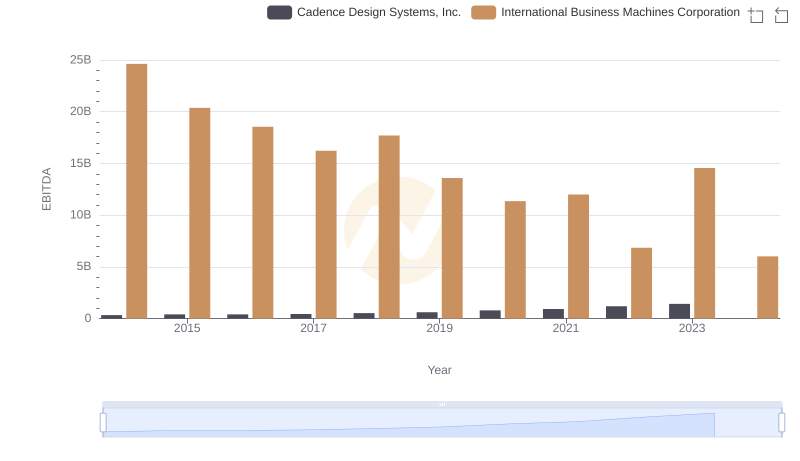
EBITDA Analysis: Evaluating International Business Machines Corporation Against Cadence Design Systems, Inc.