| __timestamp | International Business Machines Corporation | Marvell Technology, Inc. |
|---|---|---|
| Wednesday, January 1, 2014 | 46407000000 | 1750170000 |
| Thursday, January 1, 2015 | 40684000000 | 1863257000 |
| Friday, January 1, 2016 | 38516000000 | 1231092000 |
| Sunday, January 1, 2017 | 36943000000 | 1288147000 |
| Monday, January 1, 2018 | 36936000000 | 1461940000 |
| Tuesday, January 1, 2019 | 31533000000 | 1458392000 |
| Wednesday, January 1, 2020 | 30865000000 | 1356941000 |
| Friday, January 1, 2021 | 31486000000 | 1488350000 |
| Saturday, January 1, 2022 | 32687000000 | 2064225000 |
| Sunday, January 1, 2023 | 34300000000 | 2987500000 |
| Monday, January 1, 2024 | 35551000000 | 2293600000 |
Data in motion
In the ever-evolving landscape of technology, the financial performance of industry leaders like International Business Machines Corporation (IBM) and Marvell Technology, Inc. offers a fascinating glimpse into their strategic maneuvers. Over the past decade, IBM's gross profit has seen a decline of approximately 26%, from its peak in 2014 to 2023. This trend reflects the company's ongoing transformation and adaptation to new market demands. Meanwhile, Marvell Technology has experienced a remarkable growth trajectory, with its gross profit increasing by over 70% during the same period. This surge underscores Marvell's successful expansion into data infrastructure and 5G markets. As we look to 2024, IBM shows signs of recovery, while Marvell continues its upward momentum. These trends highlight the dynamic nature of the tech industry and the diverse strategies employed by its key players.
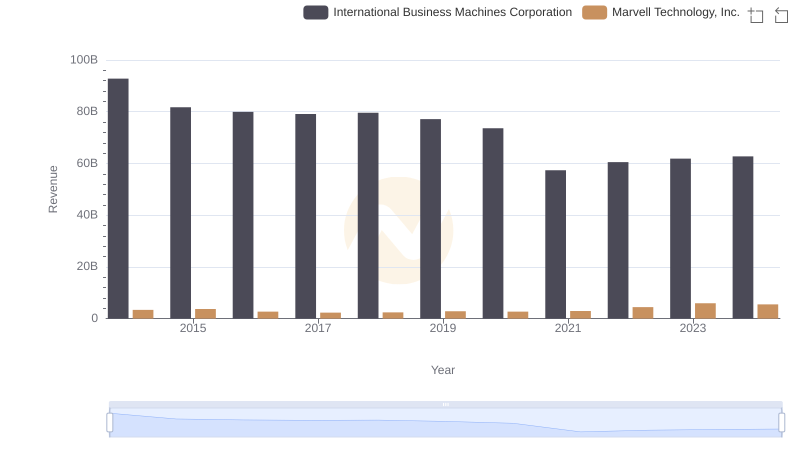
International Business Machines Corporation vs Marvell Technology, Inc.: Annual Revenue Growth Compared
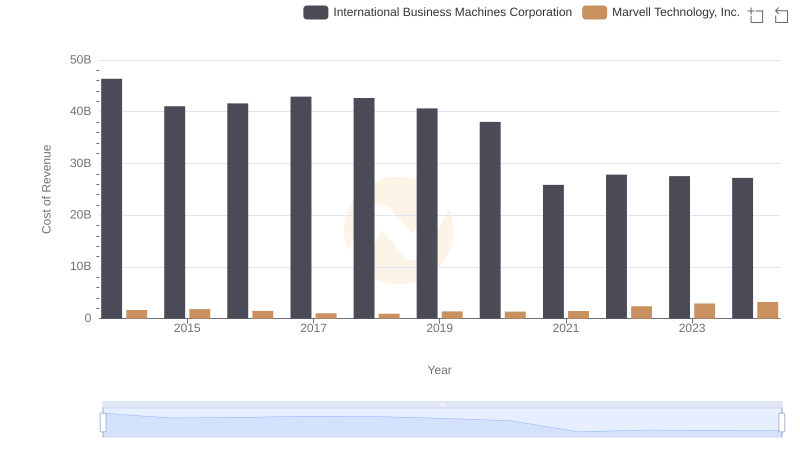
Cost Insights: Breaking Down International Business Machines Corporation and Marvell Technology, Inc.'s Expenses
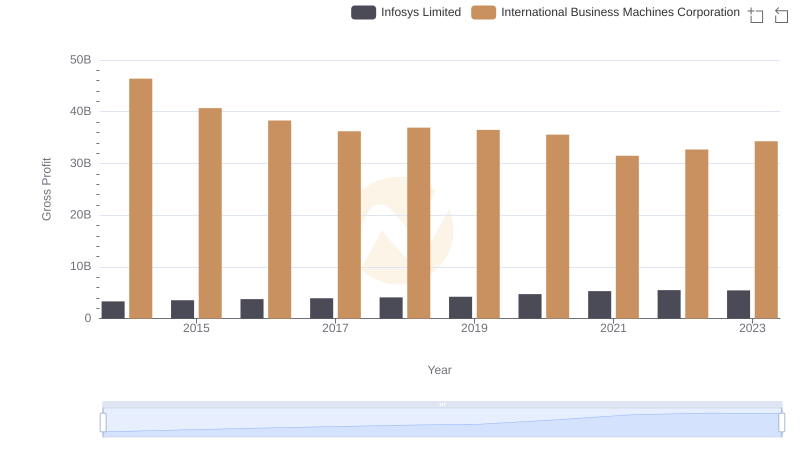
Key Insights on Gross Profit: International Business Machines Corporation vs Infosys Limited

Gross Profit Analysis: Comparing International Business Machines Corporation and Intel Corporation
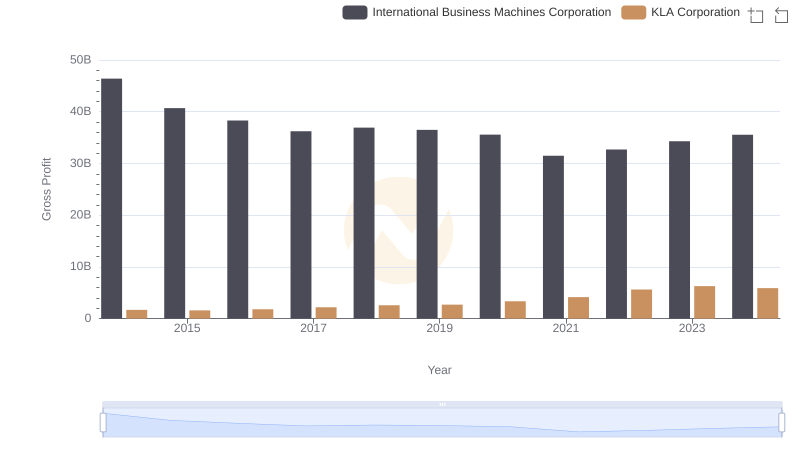
International Business Machines Corporation vs KLA Corporation: A Gross Profit Performance Breakdown
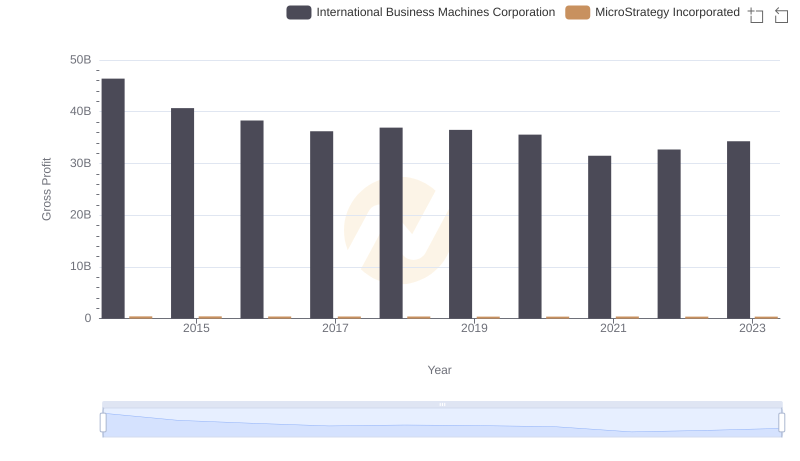
International Business Machines Corporation vs MicroStrategy Incorporated: A Gross Profit Performance Breakdown
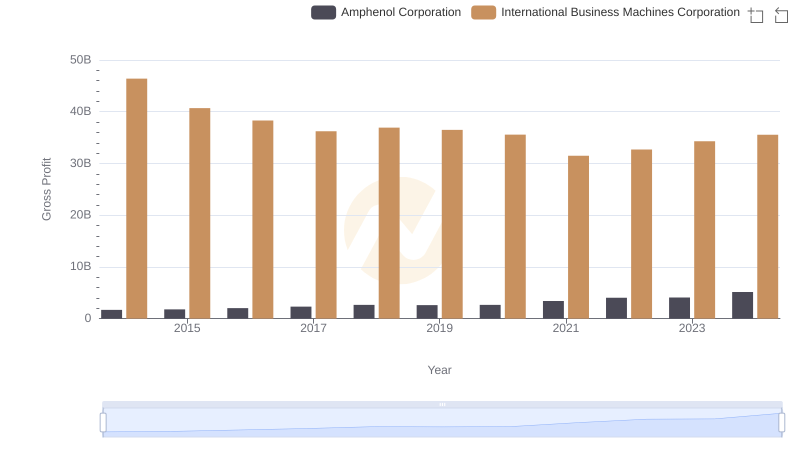
Who Generates Higher Gross Profit? International Business Machines Corporation or Amphenol Corporation
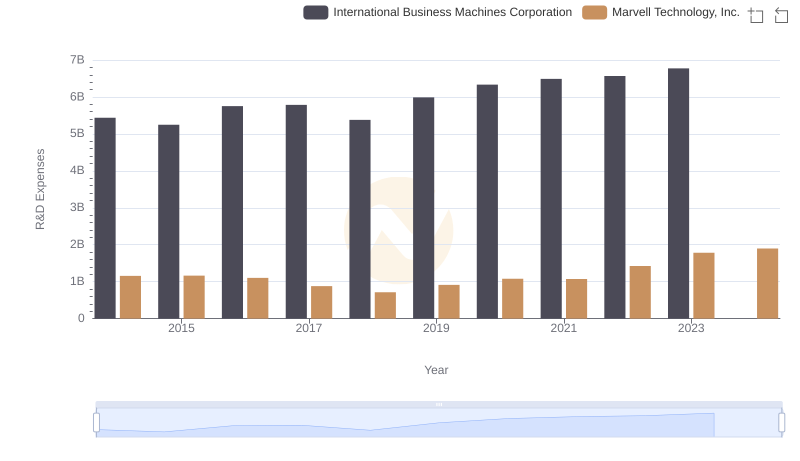
Who Prioritizes Innovation? R&D Spending Compared for International Business Machines Corporation and Marvell Technology, Inc.
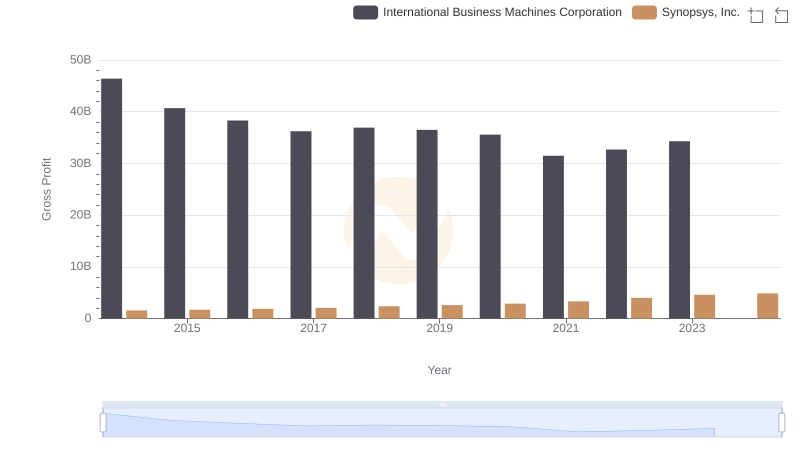
Key Insights on Gross Profit: International Business Machines Corporation vs Synopsys, Inc.
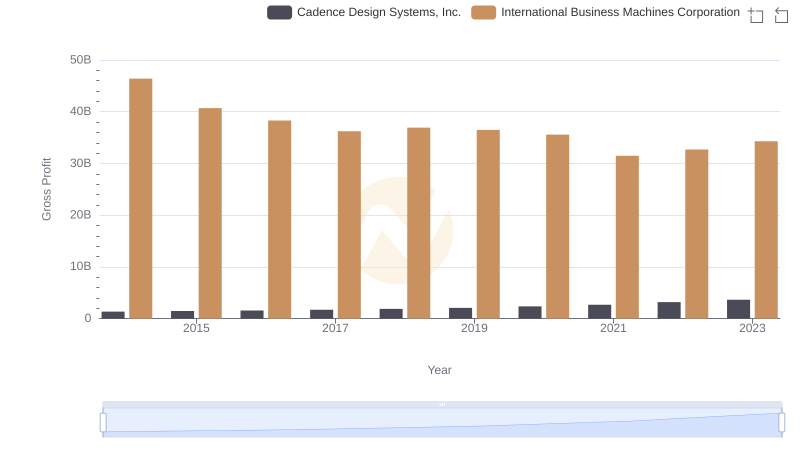
Gross Profit Analysis: Comparing International Business Machines Corporation and Cadence Design Systems, Inc.
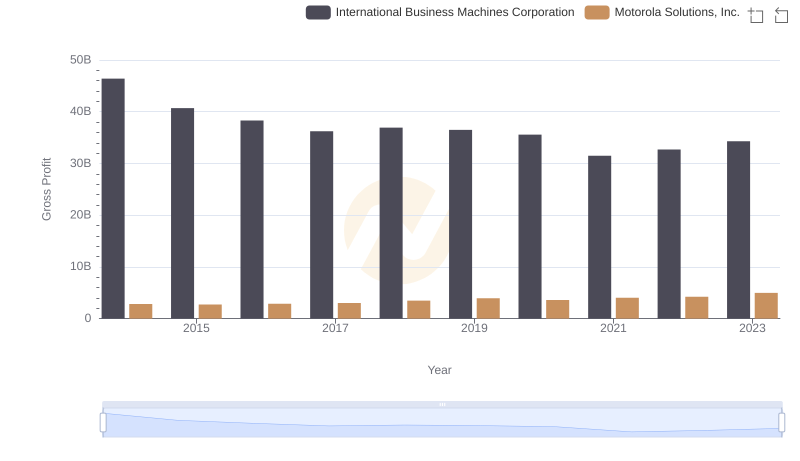
Gross Profit Trends Compared: International Business Machines Corporation vs Motorola Solutions, Inc.
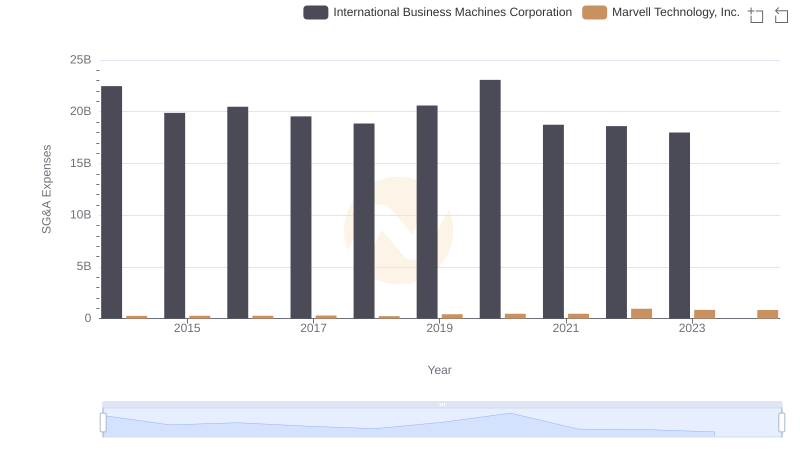
SG&A Efficiency Analysis: Comparing International Business Machines Corporation and Marvell Technology, Inc.