| __timestamp | EMCOR Group, Inc. | Stanley Black & Decker, Inc. |
|---|---|---|
| Wednesday, January 1, 2014 | 907246000 | 4102700000 |
| Thursday, January 1, 2015 | 944479000 | 4072000000 |
| Friday, January 1, 2016 | 1037862000 | 4267200000 |
| Sunday, January 1, 2017 | 1147012000 | 4778000000 |
| Monday, January 1, 2018 | 1205453000 | 4901900000 |
| Tuesday, January 1, 2019 | 1355868000 | 4805500000 |
| Wednesday, January 1, 2020 | 1395382000 | 4967900000 |
| Friday, January 1, 2021 | 1501737000 | 5194200000 |
| Saturday, January 1, 2022 | 1603594000 | 4284100000 |
| Sunday, January 1, 2023 | 2089339000 | 4098000000 |
| Monday, January 1, 2024 | 4514400000 |
In pursuit of knowledge
In the competitive landscape of industrial and construction services, EMCOR Group, Inc. and Stanley Black & Decker, Inc. have shown distinct financial trajectories over the past decade. From 2014 to 2023, EMCOR Group's gross profit surged by approximately 130%, reflecting a robust growth strategy and market adaptation. In contrast, Stanley Black & Decker experienced a more modest increase of around 0.5%, with fluctuations peaking in 2021 before a decline in 2022. This divergence highlights EMCOR's aggressive expansion and operational efficiency, while Stanley Black & Decker faced challenges in maintaining its growth momentum. The data underscores the importance of strategic agility in navigating economic shifts and industry demands. As we look to the future, these trends offer valuable insights into the evolving dynamics of the industrial sector.

Annual Revenue Comparison: EMCOR Group, Inc. vs Stanley Black & Decker, Inc.
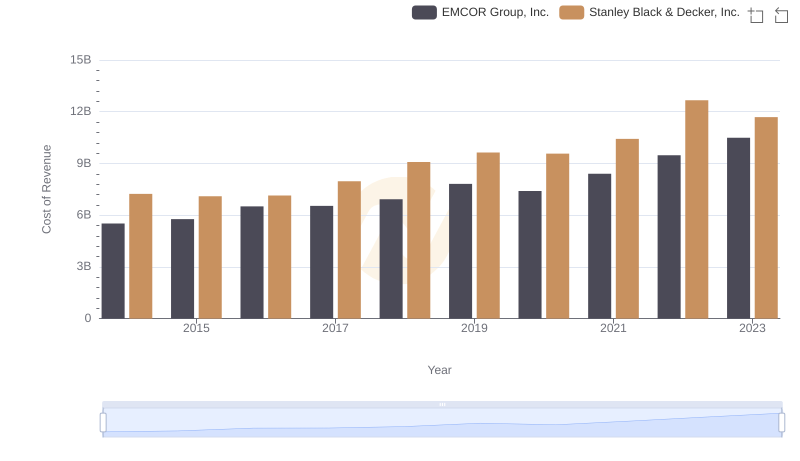
Cost of Revenue Trends: EMCOR Group, Inc. vs Stanley Black & Decker, Inc.
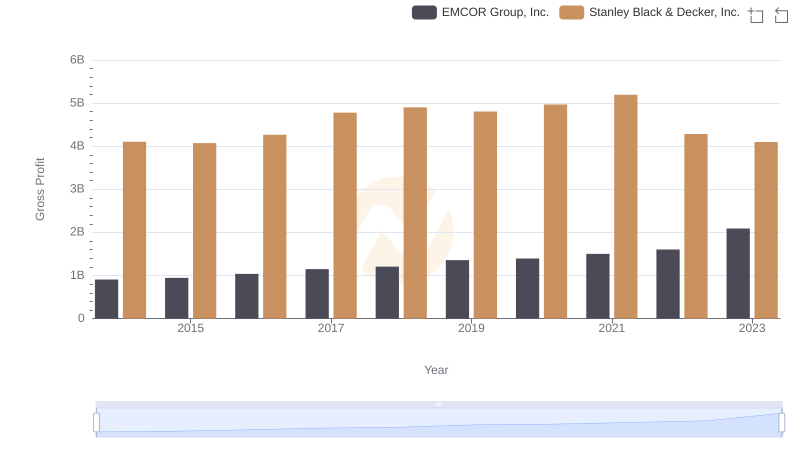
Key Insights on Gross Profit: EMCOR Group, Inc. vs Stanley Black & Decker, Inc.

A Professional Review of EBITDA: EMCOR Group, Inc. Compared to Stanley Black & Decker, Inc.
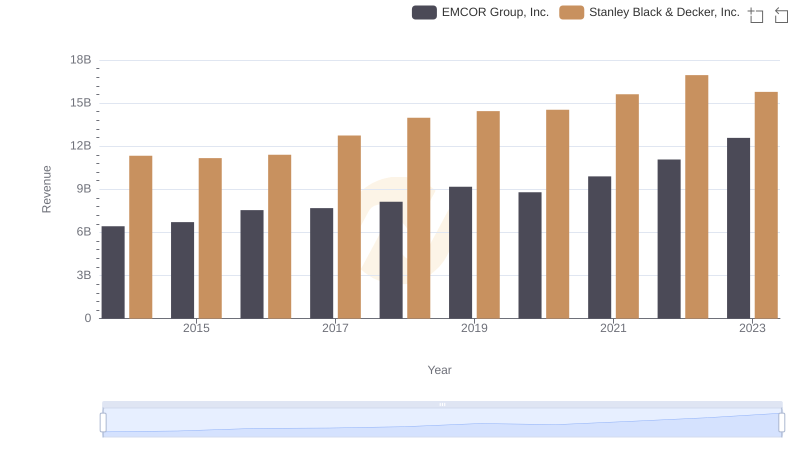
EMCOR Group, Inc. or Stanley Black & Decker, Inc.: Who Leads in Yearly Revenue?

Cost of Revenue: Key Insights for EMCOR Group, Inc. and Stanley Black & Decker, Inc.
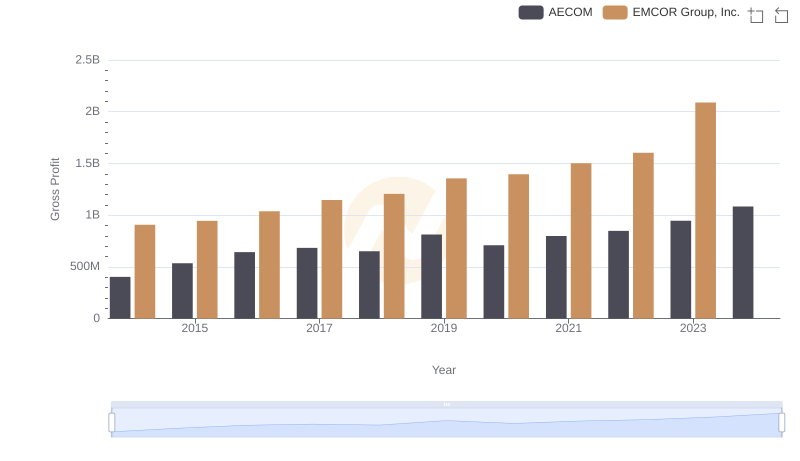
Who Generates Higher Gross Profit? EMCOR Group, Inc. or AECOM
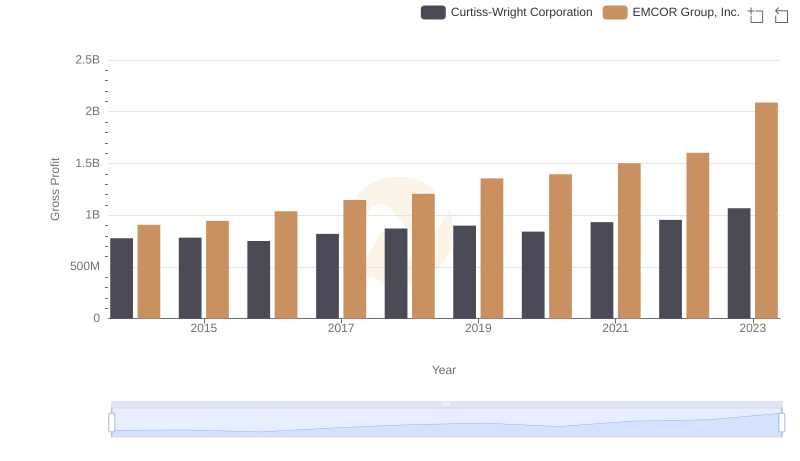
EMCOR Group, Inc. and Curtiss-Wright Corporation: A Detailed Gross Profit Analysis

Gross Profit Analysis: Comparing EMCOR Group, Inc. and U-Haul Holding Company
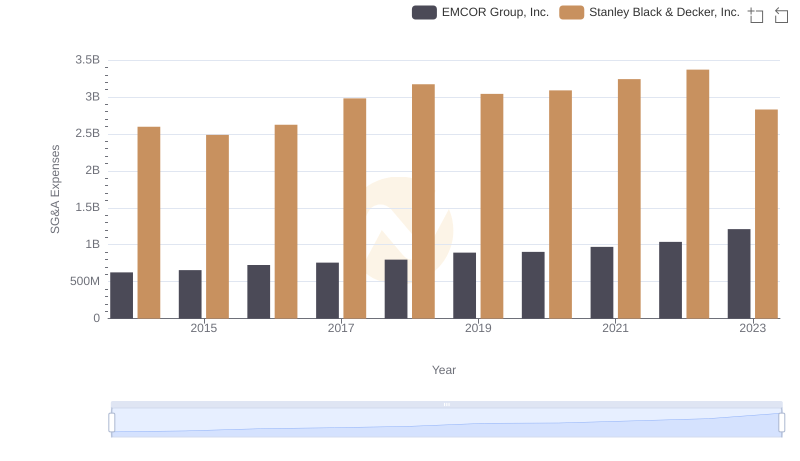
Selling, General, and Administrative Costs: EMCOR Group, Inc. vs Stanley Black & Decker, Inc.
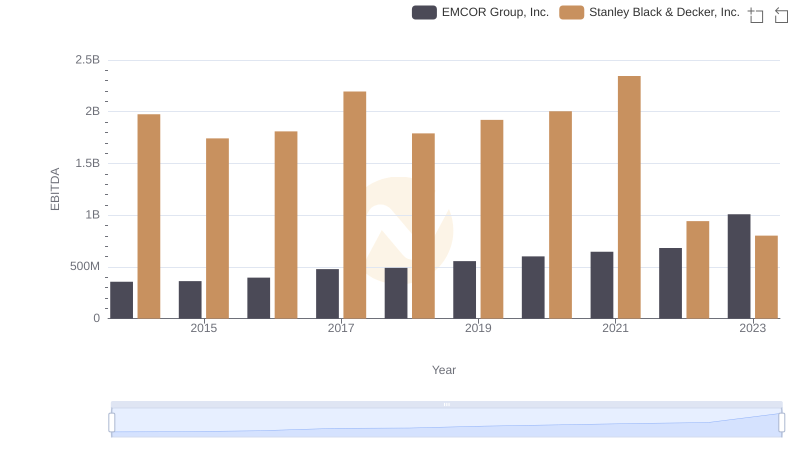
EMCOR Group, Inc. and Stanley Black & Decker, Inc.: A Detailed Examination of EBITDA Performance