| __timestamp | EMCOR Group, Inc. | Graco Inc. |
|---|---|---|
| Wednesday, January 1, 2014 | 907246000 | 666736000 |
| Thursday, January 1, 2015 | 944479000 | 684700000 |
| Friday, January 1, 2016 | 1037862000 | 708239000 |
| Sunday, January 1, 2017 | 1147012000 | 793049000 |
| Monday, January 1, 2018 | 1205453000 | 882539000 |
| Tuesday, January 1, 2019 | 1355868000 | 859756000 |
| Wednesday, January 1, 2020 | 1395382000 | 854937000 |
| Friday, January 1, 2021 | 1501737000 | 1033949000 |
| Saturday, January 1, 2022 | 1603594000 | 1057439000 |
| Sunday, January 1, 2023 | 2089339000 | 1161021000 |
| Monday, January 1, 2024 | 1122461000 |
Unleashing the power of data
In the ever-evolving landscape of industrial giants, EMCOR Group, Inc. and Graco Inc. have showcased remarkable financial trajectories over the past decade. From 2014 to 2023, EMCOR's gross profit surged by approximately 130%, peaking in 2023 with a notable increase. This growth reflects EMCOR's strategic expansions and operational efficiencies. Meanwhile, Graco Inc. demonstrated a steady upward trend, with a 74% rise in gross profit over the same period, highlighting its resilience and adaptability in the market.
These trends underscore the dynamic nature of the industrial sector, where strategic foresight and adaptability are key to sustained success.
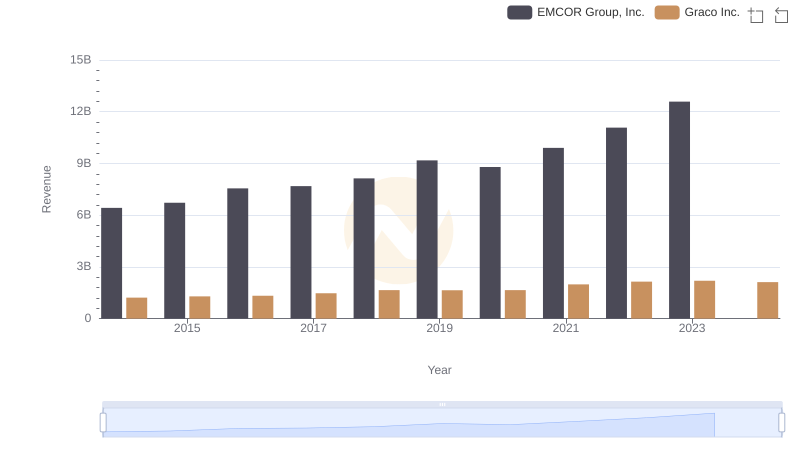
Annual Revenue Comparison: EMCOR Group, Inc. vs Graco Inc.
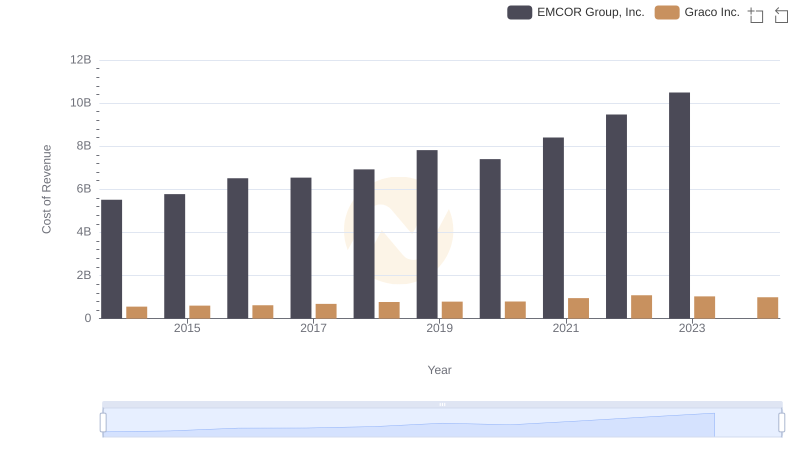
Cost of Revenue Trends: EMCOR Group, Inc. vs Graco Inc.
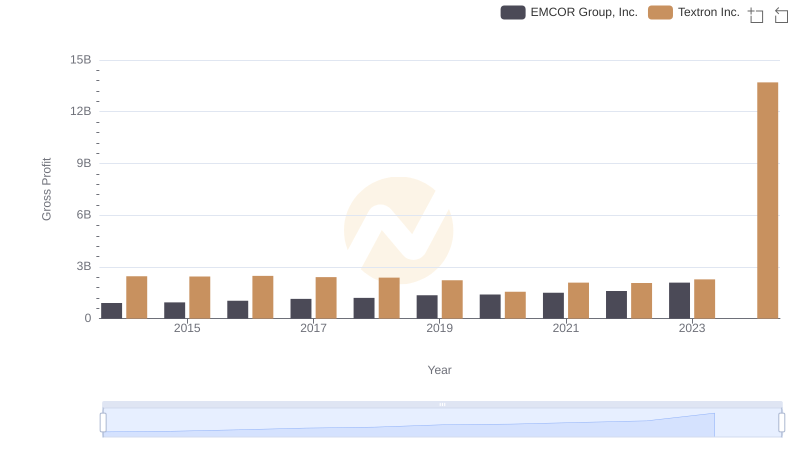
Gross Profit Comparison: EMCOR Group, Inc. and Textron Inc. Trends
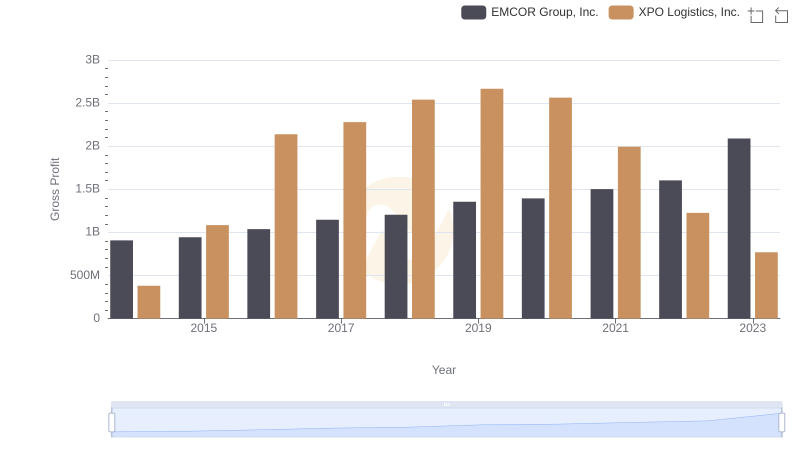
Gross Profit Comparison: EMCOR Group, Inc. and XPO Logistics, Inc. Trends
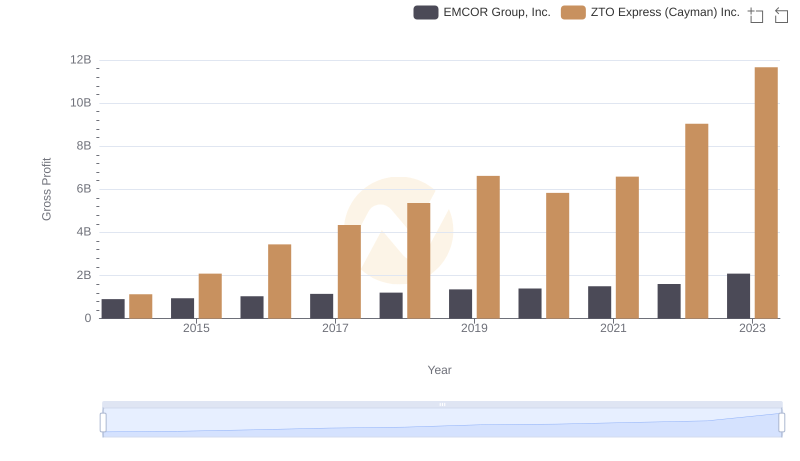
Gross Profit Comparison: EMCOR Group, Inc. and ZTO Express (Cayman) Inc. Trends
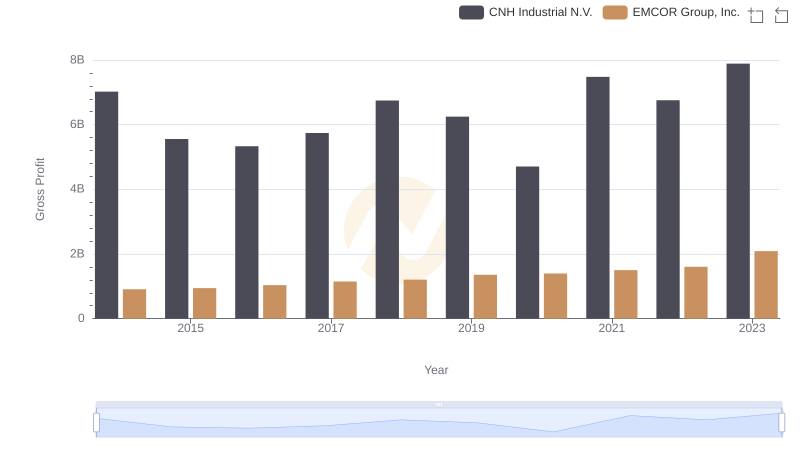
Key Insights on Gross Profit: EMCOR Group, Inc. vs CNH Industrial N.V.
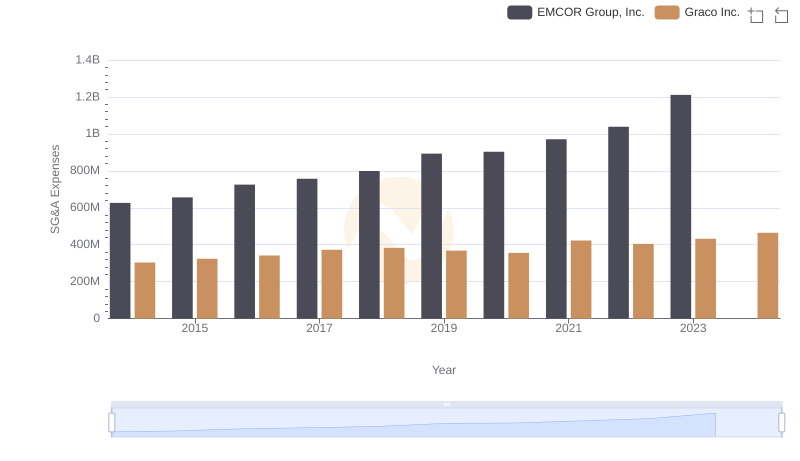
Breaking Down SG&A Expenses: EMCOR Group, Inc. vs Graco Inc.
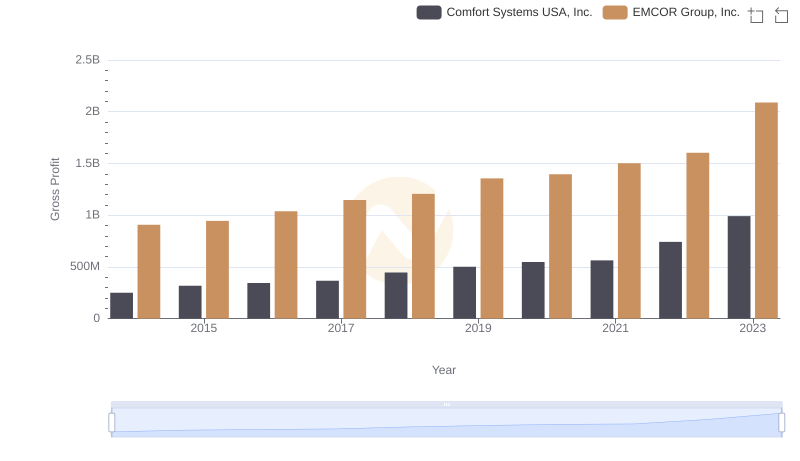
EMCOR Group, Inc. vs Comfort Systems USA, Inc.: A Gross Profit Performance Breakdown
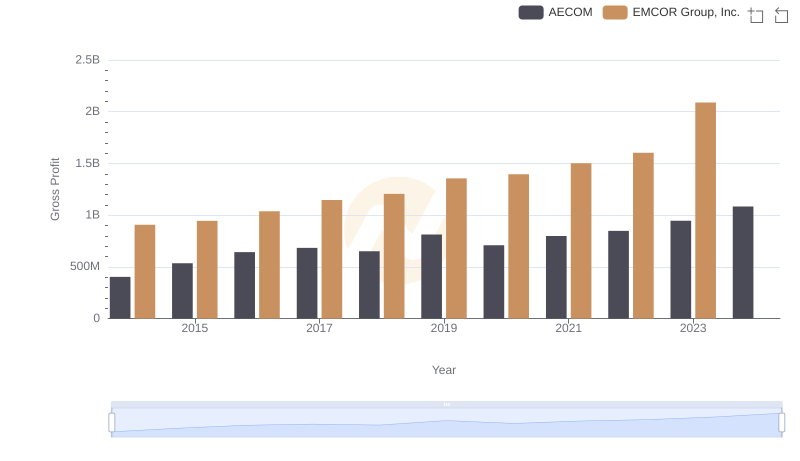
Who Generates Higher Gross Profit? EMCOR Group, Inc. or AECOM
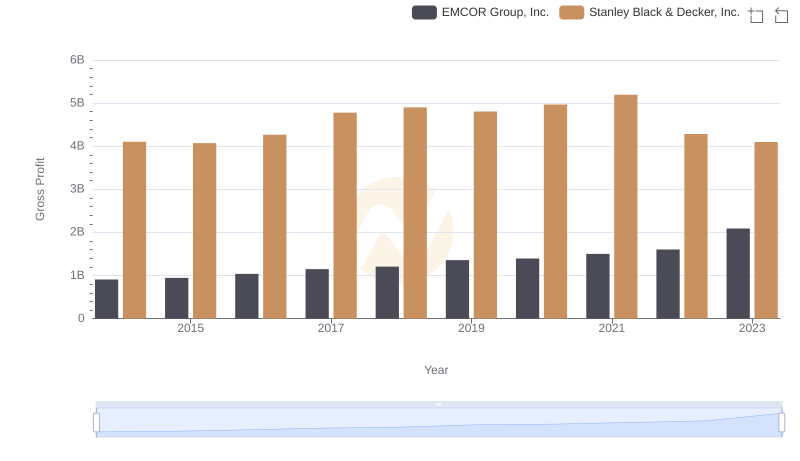
Gross Profit Comparison: EMCOR Group, Inc. and Stanley Black & Decker, Inc. Trends
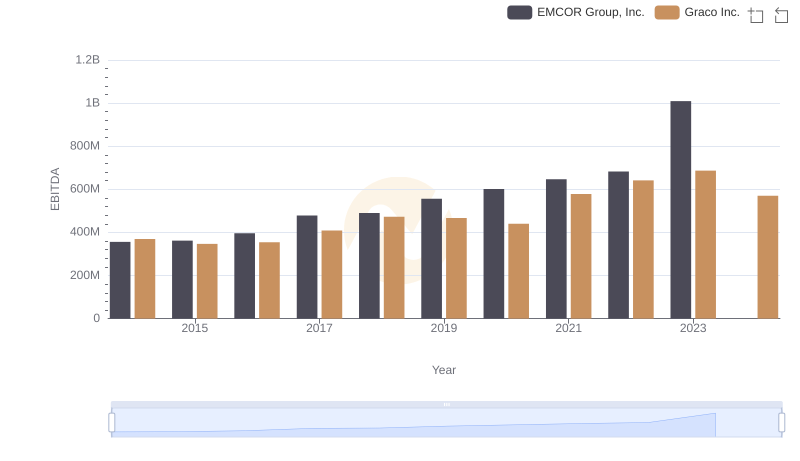
A Professional Review of EBITDA: EMCOR Group, Inc. Compared to Graco Inc.