| __timestamp | EMCOR Group, Inc. | U-Haul Holding Company |
|---|---|---|
| Wednesday, January 1, 2014 | 907246000 | 2707982000 |
| Thursday, January 1, 2015 | 944479000 | 2928459000 |
| Friday, January 1, 2016 | 1037862000 | 3130666000 |
| Sunday, January 1, 2017 | 1147012000 | 3269282000 |
| Monday, January 1, 2018 | 1205453000 | 3440625000 |
| Tuesday, January 1, 2019 | 1355868000 | 3606565000 |
| Wednesday, January 1, 2020 | 1395382000 | 3814850000 |
| Friday, January 1, 2021 | 1501737000 | 4327926000 |
| Saturday, January 1, 2022 | 1603594000 | 5480162000 |
| Sunday, January 1, 2023 | 2089339000 | 5019797000 |
| Monday, January 1, 2024 | 1649634000 |
Unlocking the unknown
In the competitive landscape of American business, understanding the financial health of industry leaders is crucial. This analysis delves into the gross profit trends of EMCOR Group, Inc. and U-Haul Holding Company from 2014 to 2023. Over this period, U-Haul consistently outperformed EMCOR, with its gross profit peaking at approximately 5.5 billion in 2022, marking a staggering 102% increase from 2014. In contrast, EMCOR's gross profit grew by about 130%, reaching its zenith in 2023. Notably, U-Haul's profits dipped in 2023, while EMCOR continued its upward trajectory. This divergence highlights the resilience of EMCOR in the face of economic challenges. Missing data for 2024 suggests a need for cautious optimism. As these giants navigate the future, stakeholders must remain vigilant, adapting strategies to sustain growth in an ever-evolving market.
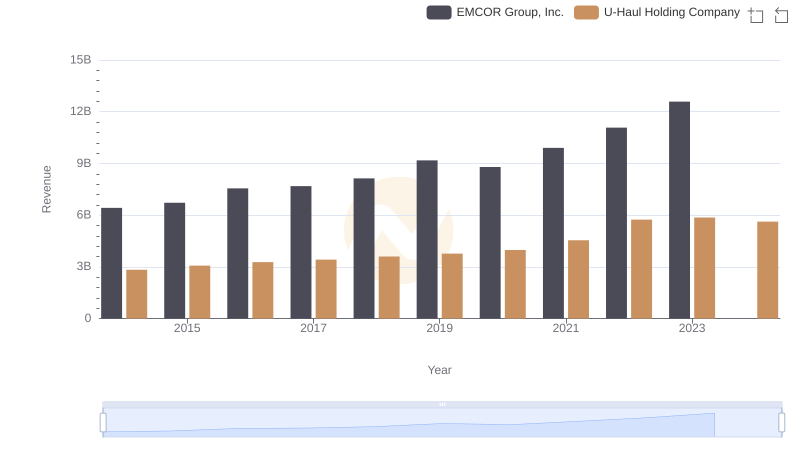
Comparing Revenue Performance: EMCOR Group, Inc. or U-Haul Holding Company?
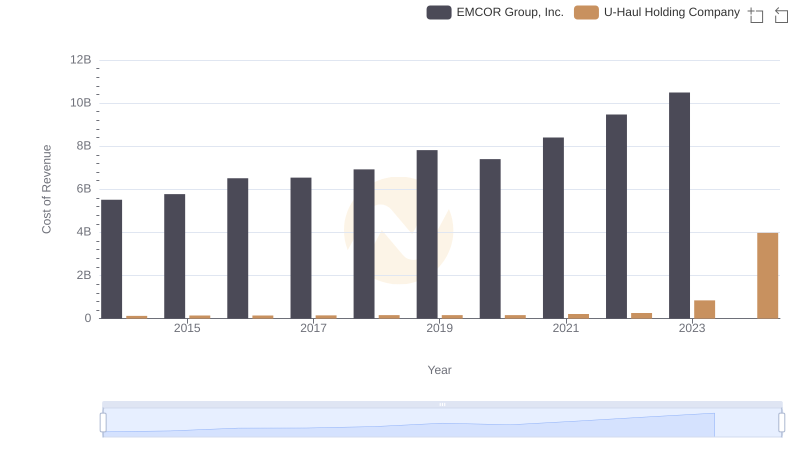
EMCOR Group, Inc. vs U-Haul Holding Company: Efficiency in Cost of Revenue Explored
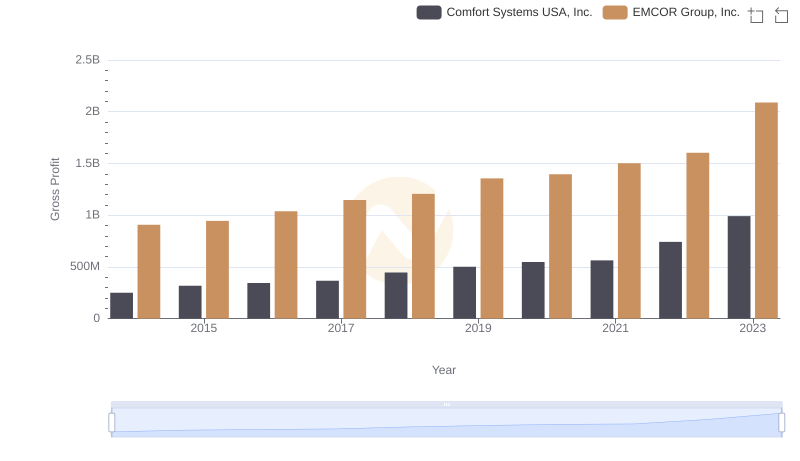
EMCOR Group, Inc. vs Comfort Systems USA, Inc.: A Gross Profit Performance Breakdown
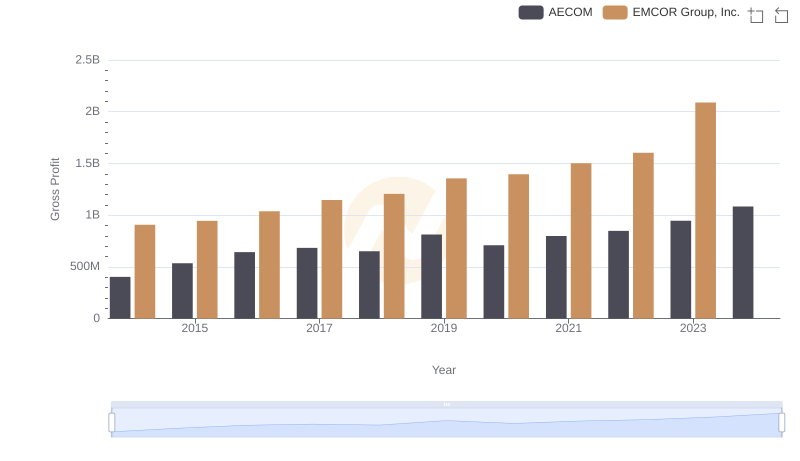
Who Generates Higher Gross Profit? EMCOR Group, Inc. or AECOM
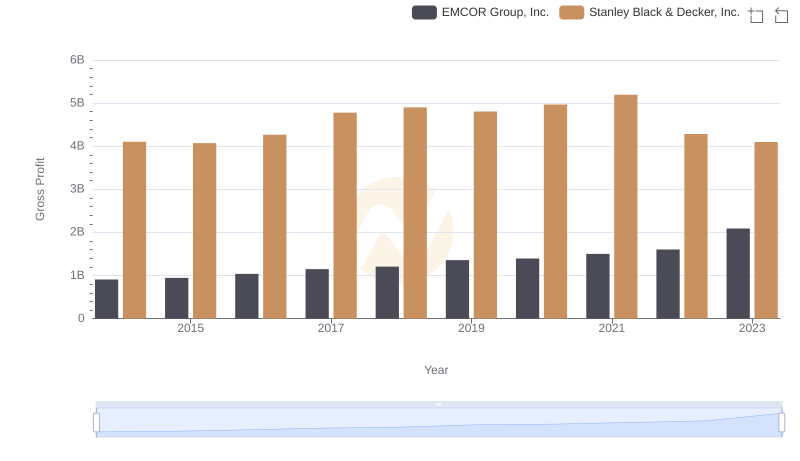
Gross Profit Comparison: EMCOR Group, Inc. and Stanley Black & Decker, Inc. Trends
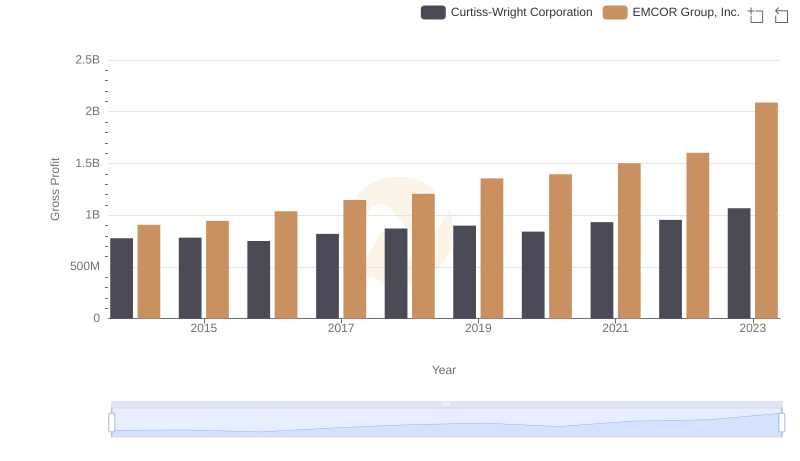
EMCOR Group, Inc. and Curtiss-Wright Corporation: A Detailed Gross Profit Analysis
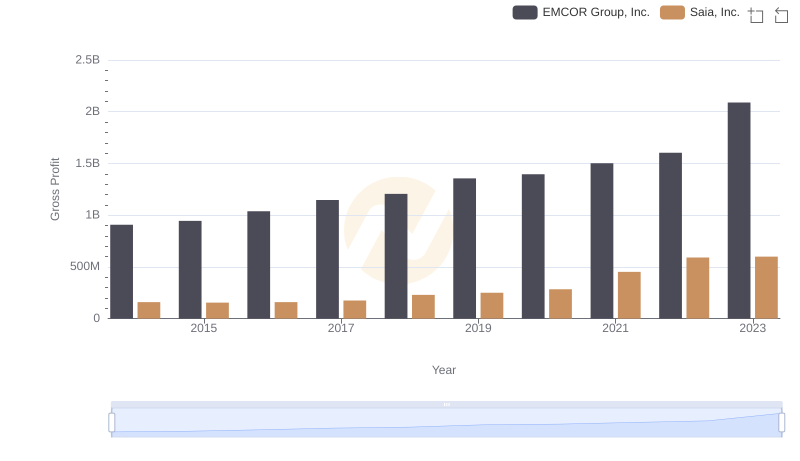
Gross Profit Trends Compared: EMCOR Group, Inc. vs Saia, Inc.
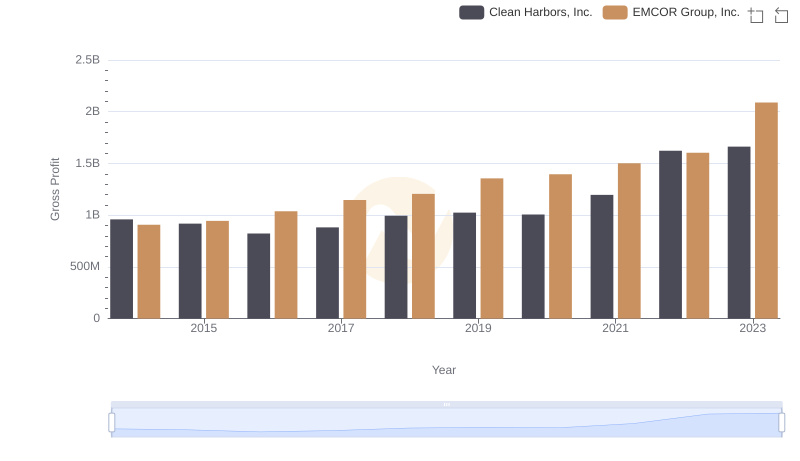
EMCOR Group, Inc. and Clean Harbors, Inc.: A Detailed Gross Profit Analysis
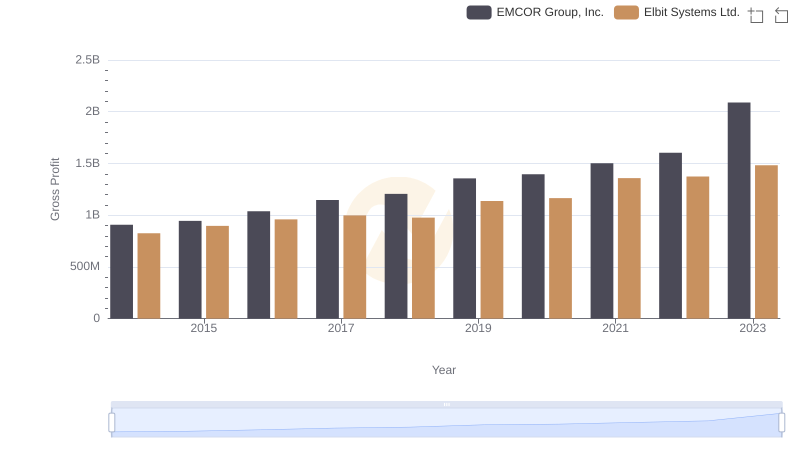
EMCOR Group, Inc. vs Elbit Systems Ltd.: A Gross Profit Performance Breakdown
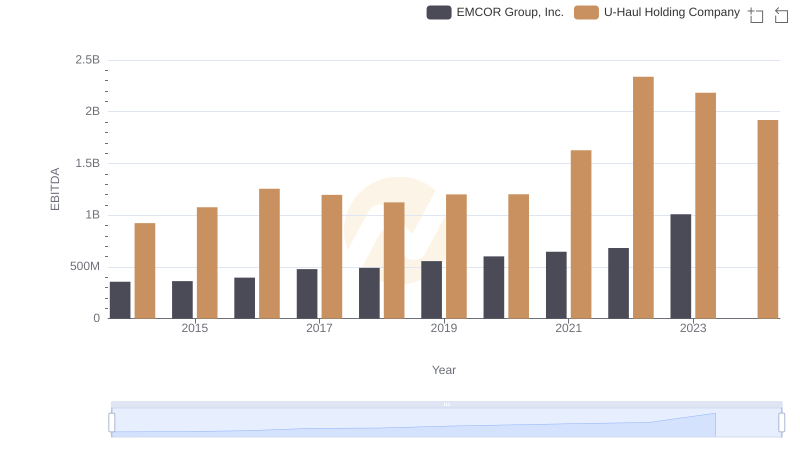
Professional EBITDA Benchmarking: EMCOR Group, Inc. vs U-Haul Holding Company