| __timestamp | Comfort Systems USA, Inc. | EMCOR Group, Inc. |
|---|---|---|
| Wednesday, January 1, 2014 | 249771000 | 907246000 |
| Thursday, January 1, 2015 | 318129000 | 944479000 |
| Friday, January 1, 2016 | 344009000 | 1037862000 |
| Sunday, January 1, 2017 | 366281000 | 1147012000 |
| Monday, January 1, 2018 | 446279000 | 1205453000 |
| Tuesday, January 1, 2019 | 501943000 | 1355868000 |
| Wednesday, January 1, 2020 | 546983000 | 1395382000 |
| Friday, January 1, 2021 | 563207000 | 1501737000 |
| Saturday, January 1, 2022 | 741608000 | 1603594000 |
| Sunday, January 1, 2023 | 990509000 | 2089339000 |
Unleashing the power of data
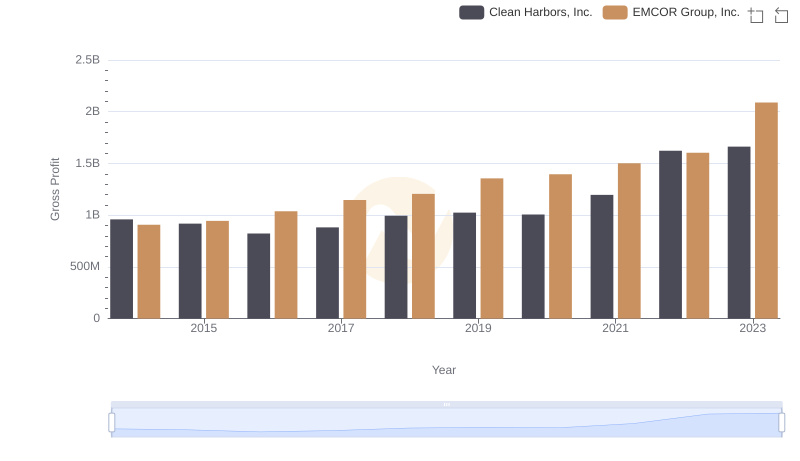
In the competitive landscape of the construction and engineering sectors, EMCOR Group, Inc. and Comfort Systems USA, Inc. have demonstrated remarkable growth in gross profit over the past decade. From 2014 to 2023, EMCOR Group's gross profit surged by approximately 130%, reaching its peak in 2023. Comfort Systems USA, Inc. also showed impressive growth, with a 296% increase over the same period.
This data highlights the resilience and strategic growth of these companies, reflecting broader industry trends and economic conditions. As the market evolves, these insights provide valuable benchmarks for stakeholders and investors.
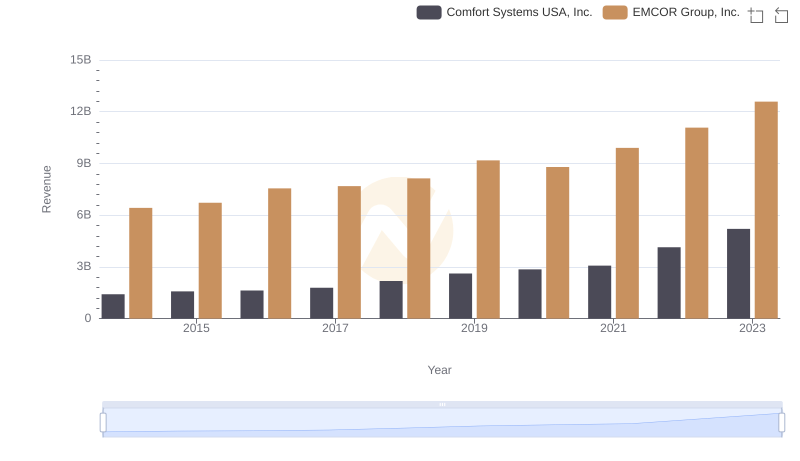
EMCOR Group, Inc. vs Comfort Systems USA, Inc.: Examining Key Revenue Metrics
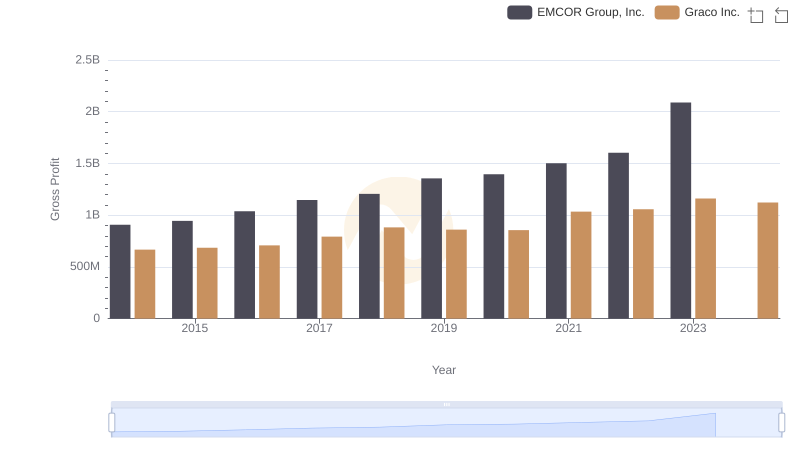
EMCOR Group, Inc. and Graco Inc.: A Detailed Gross Profit Analysis
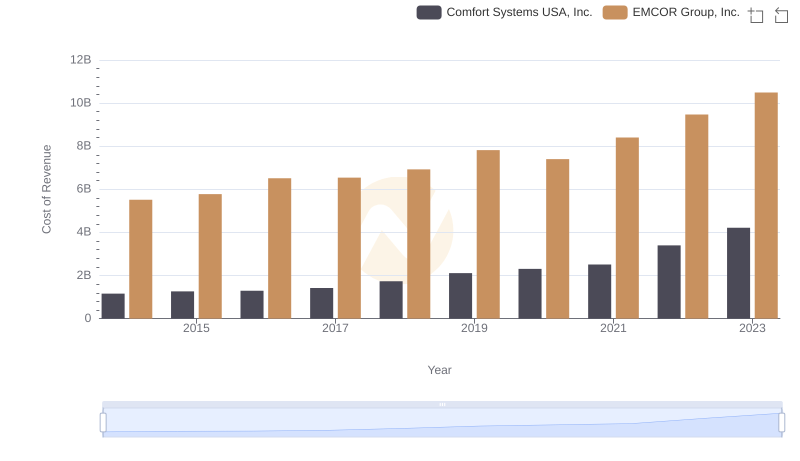
Cost of Revenue Trends: EMCOR Group, Inc. vs Comfort Systems USA, Inc.
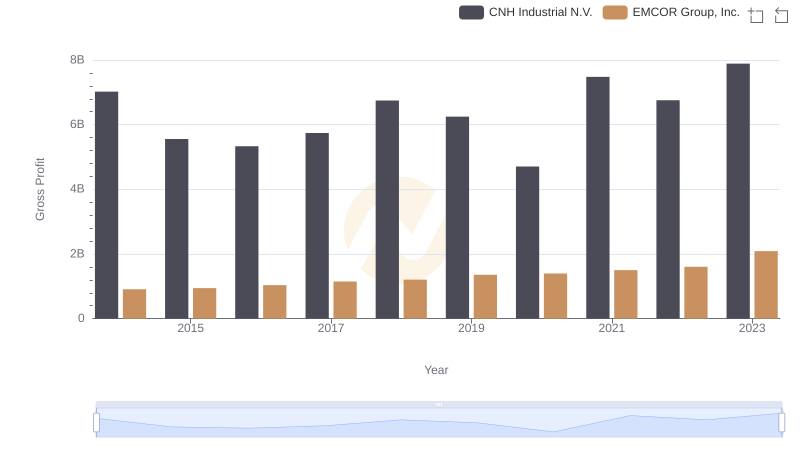
Key Insights on Gross Profit: EMCOR Group, Inc. vs CNH Industrial N.V.
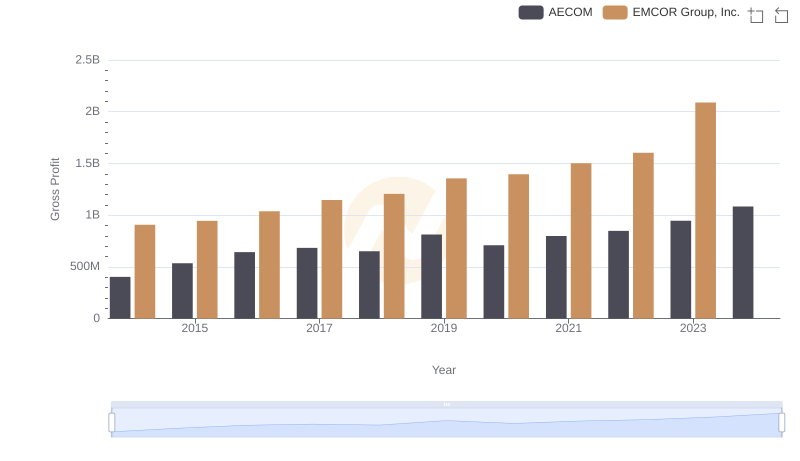
Who Generates Higher Gross Profit? EMCOR Group, Inc. or AECOM
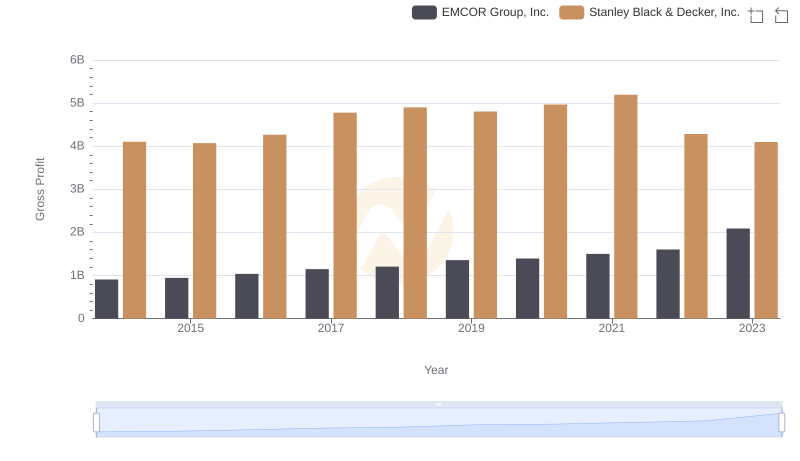
Gross Profit Comparison: EMCOR Group, Inc. and Stanley Black & Decker, Inc. Trends
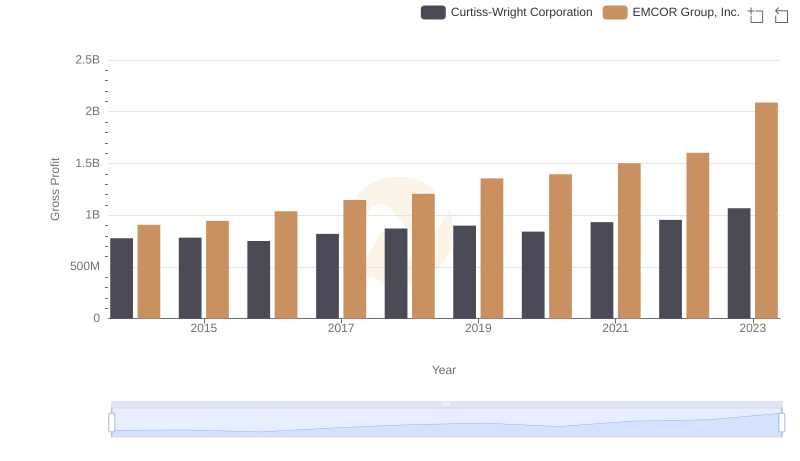
EMCOR Group, Inc. and Curtiss-Wright Corporation: A Detailed Gross Profit Analysis

Gross Profit Analysis: Comparing EMCOR Group, Inc. and U-Haul Holding Company
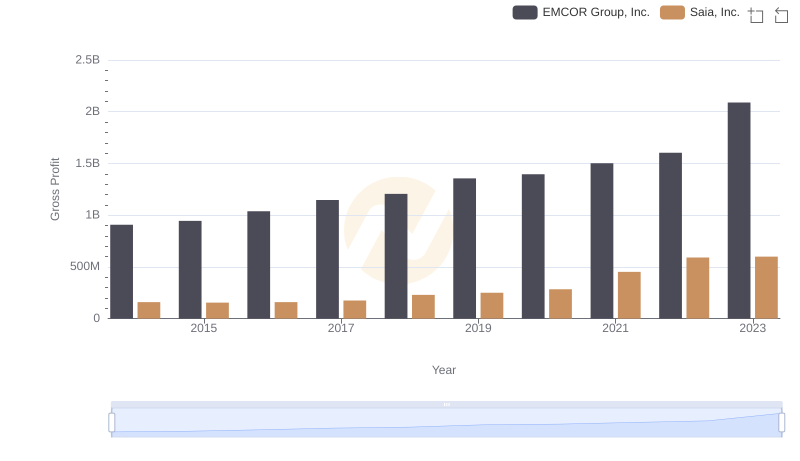
Gross Profit Trends Compared: EMCOR Group, Inc. vs Saia, Inc.
EMCOR Group, Inc. and Clean Harbors, Inc.: A Detailed Gross Profit Analysis