| __timestamp | Curtiss-Wright Corporation | EMCOR Group, Inc. |
|---|---|---|
| Wednesday, January 1, 2014 | 776516000 | 907246000 |
| Thursday, January 1, 2015 | 783255000 | 944479000 |
| Friday, January 1, 2016 | 750483000 | 1037862000 |
| Sunday, January 1, 2017 | 818595000 | 1147012000 |
| Monday, January 1, 2018 | 871261000 | 1205453000 |
| Tuesday, January 1, 2019 | 898745000 | 1355868000 |
| Wednesday, January 1, 2020 | 841227000 | 1395382000 |
| Friday, January 1, 2021 | 933356000 | 1501737000 |
| Saturday, January 1, 2022 | 954609000 | 1603594000 |
| Sunday, January 1, 2023 | 1067178000 | 2089339000 |
| Monday, January 1, 2024 | 1153549000 |
Unleashing the power of data
In the competitive landscape of industrial giants, EMCOR Group, Inc. and Curtiss-Wright Corporation have showcased remarkable growth in gross profit over the past decade. From 2014 to 2023, EMCOR's gross profit surged by approximately 130%, reaching its peak in 2023. Meanwhile, Curtiss-Wright experienced a steady increase of around 37% during the same period.
EMCOR's gross profit consistently outpaced Curtiss-Wright's, with a notable leap in 2023, where it nearly doubled Curtiss-Wright's figures. This growth trajectory highlights EMCOR's strategic prowess in capitalizing on market opportunities.
While both companies have shown resilience, EMCOR's ability to maintain a higher growth rate underscores its competitive edge. As the industrial sector evolves, these insights provide a glimpse into the strategic maneuvers that define industry leaders.
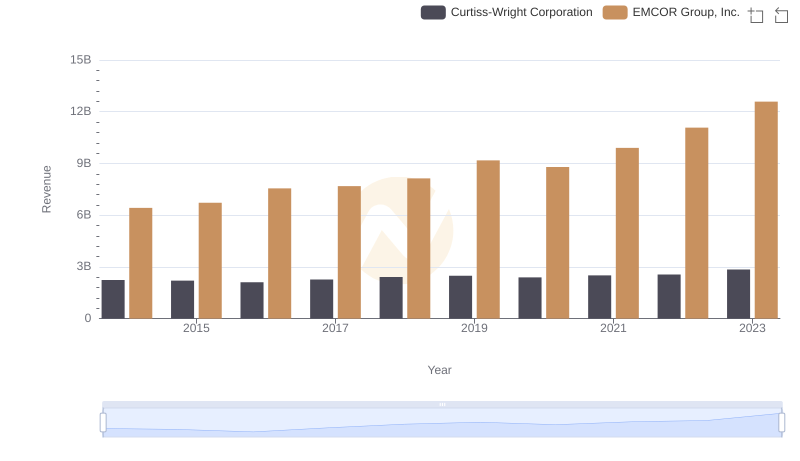
Comparing Revenue Performance: EMCOR Group, Inc. or Curtiss-Wright Corporation?
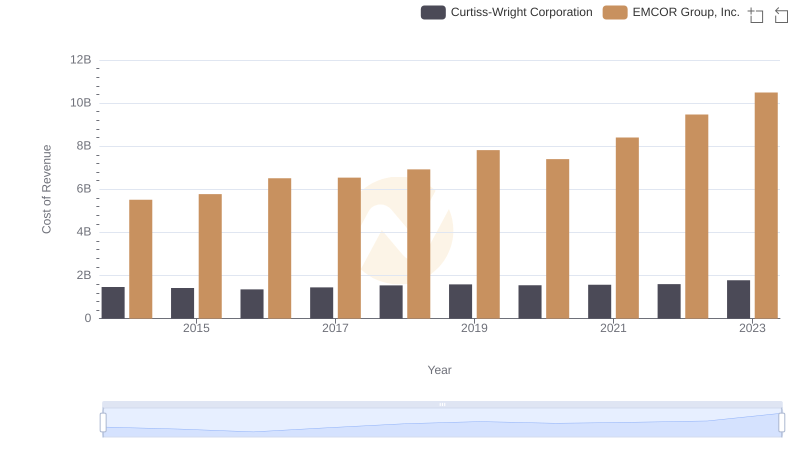
Comparing Cost of Revenue Efficiency: EMCOR Group, Inc. vs Curtiss-Wright Corporation
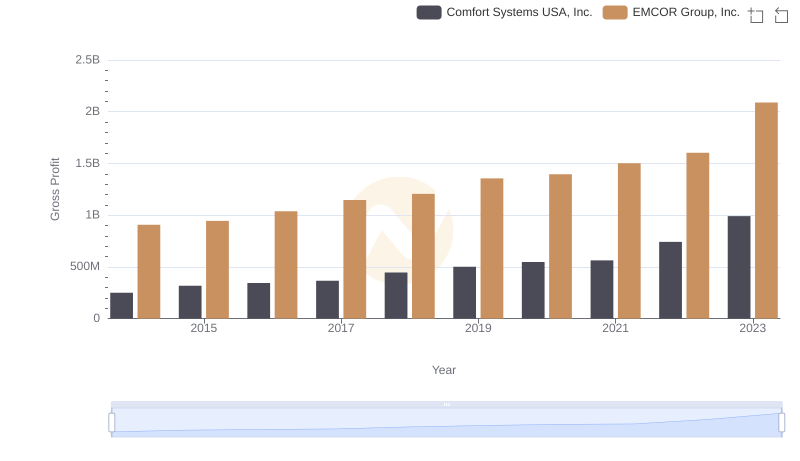
EMCOR Group, Inc. vs Comfort Systems USA, Inc.: A Gross Profit Performance Breakdown
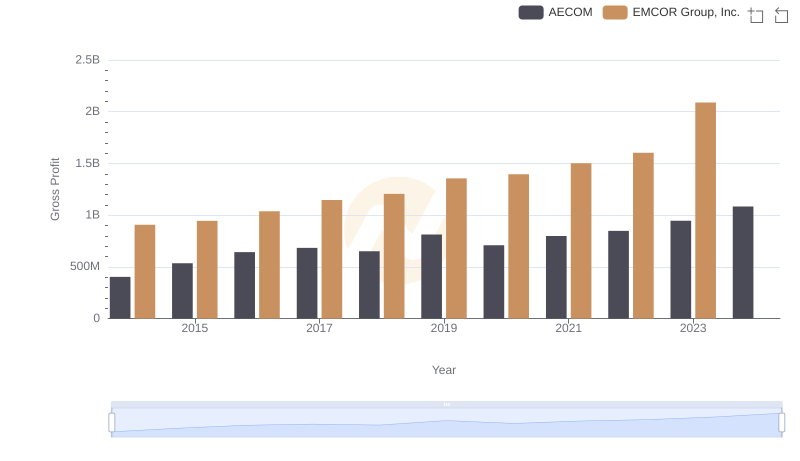
Who Generates Higher Gross Profit? EMCOR Group, Inc. or AECOM
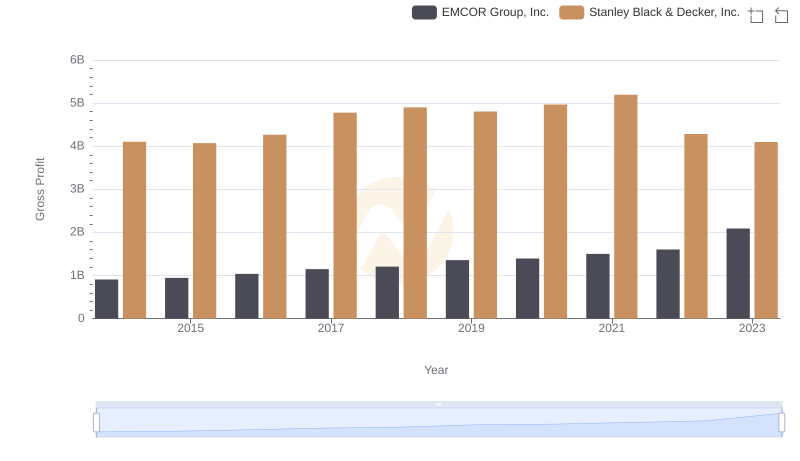
Gross Profit Comparison: EMCOR Group, Inc. and Stanley Black & Decker, Inc. Trends

Gross Profit Analysis: Comparing EMCOR Group, Inc. and U-Haul Holding Company
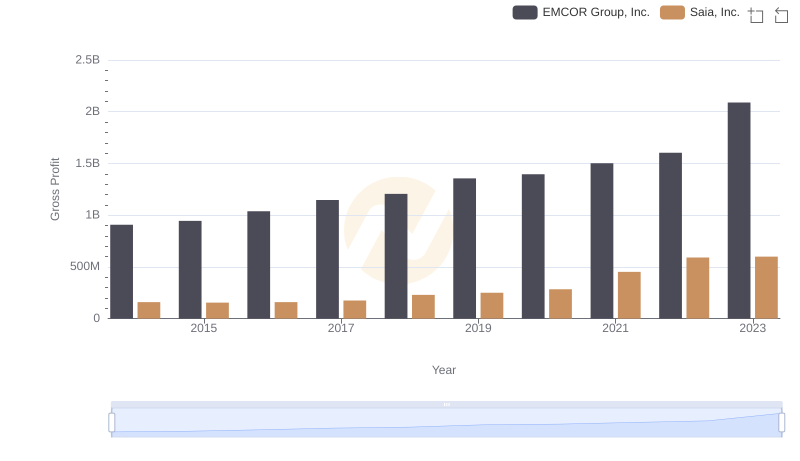
Gross Profit Trends Compared: EMCOR Group, Inc. vs Saia, Inc.
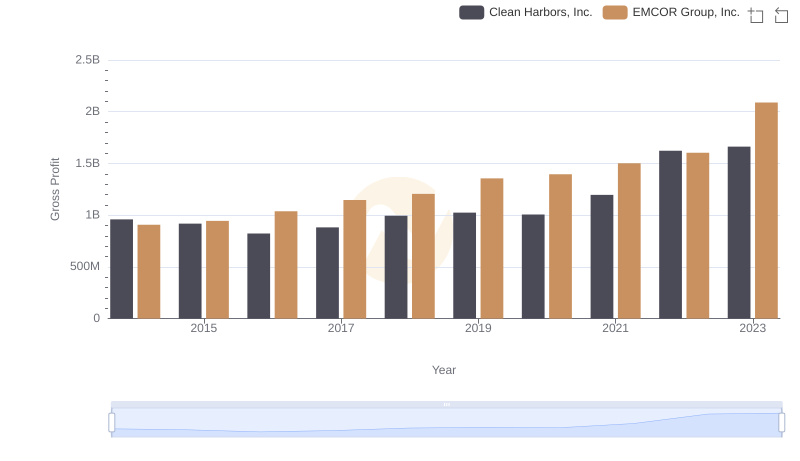
EMCOR Group, Inc. and Clean Harbors, Inc.: A Detailed Gross Profit Analysis
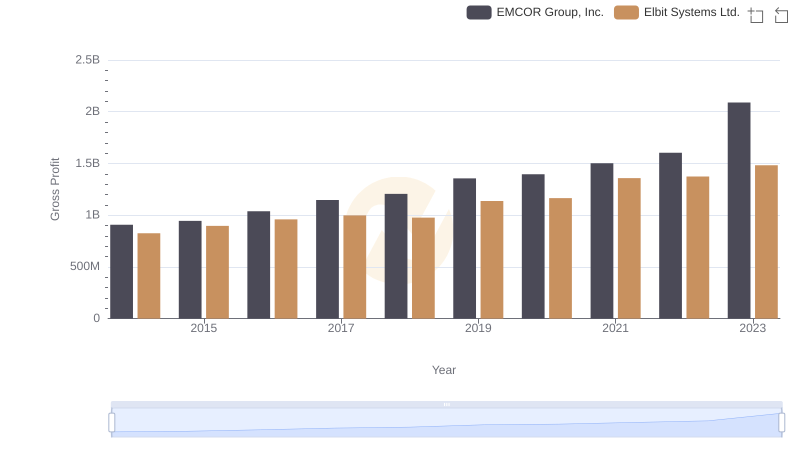
EMCOR Group, Inc. vs Elbit Systems Ltd.: A Gross Profit Performance Breakdown
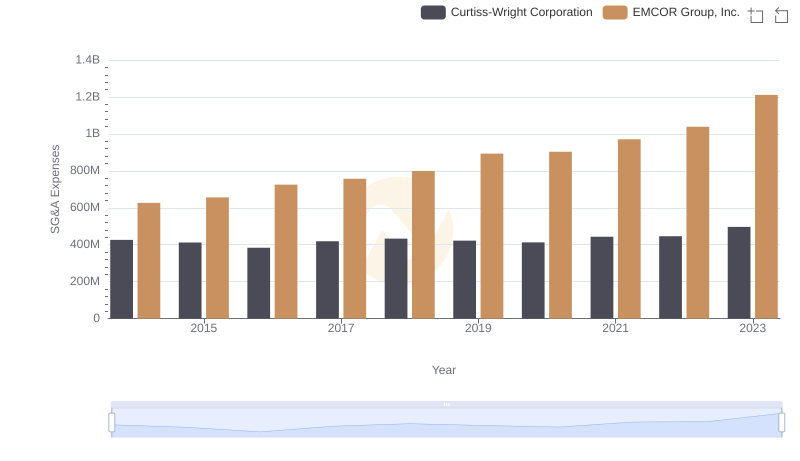
EMCOR Group, Inc. vs Curtiss-Wright Corporation: SG&A Expense Trends
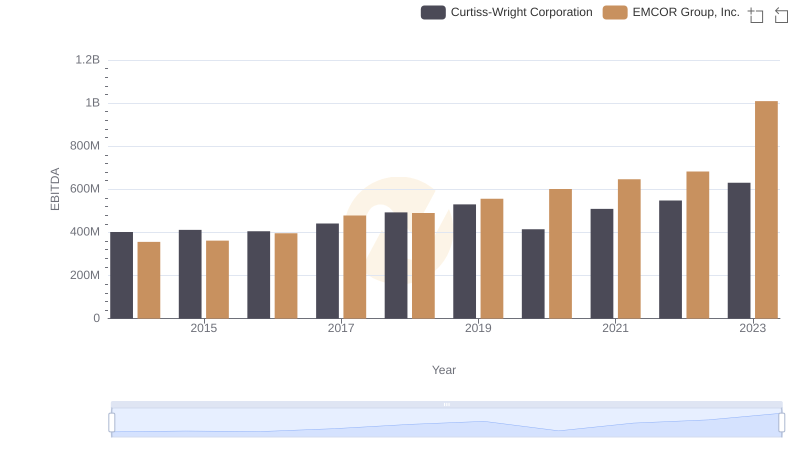
EBITDA Metrics Evaluated: EMCOR Group, Inc. vs Curtiss-Wright Corporation