| __timestamp | AMETEK, Inc. | Ferguson plc |
|---|---|---|
| Wednesday, January 1, 2014 | 1424947000 | 6203188666 |
| Thursday, January 1, 2015 | 1425015000 | 5816457079 |
| Friday, January 1, 2016 | 1264867000 | 5389727937 |
| Sunday, January 1, 2017 | 1448739000 | 5793596551 |
| Monday, January 1, 2018 | 1659562000 | 6044000000 |
| Tuesday, January 1, 2019 | 1787660000 | 6458000000 |
| Wednesday, January 1, 2020 | 1543514000 | 6421000000 |
| Friday, January 1, 2021 | 1912614000 | 6980000000 |
| Saturday, January 1, 2022 | 2145269000 | 8756000000 |
| Sunday, January 1, 2023 | 2384465001 | 9025000000 |
| Monday, January 1, 2024 | 6941180000 | 9053000000 |
Igniting the spark of knowledge
In the world of industrial manufacturing and distribution, AMETEK, Inc. and Ferguson plc stand as titans. Over the past decade, these companies have showcased remarkable growth in gross profit, a key indicator of financial health. From 2014 to 2023, AMETEK, Inc. saw its gross profit soar by approximately 67%, peaking in 2023. Meanwhile, Ferguson plc experienced a robust 45% increase, reaching its zenith in the same year.
As we look to the future, the absence of data for AMETEK in 2024 leaves room for speculation. Will it continue its upward trajectory, or will Ferguson maintain its lead?
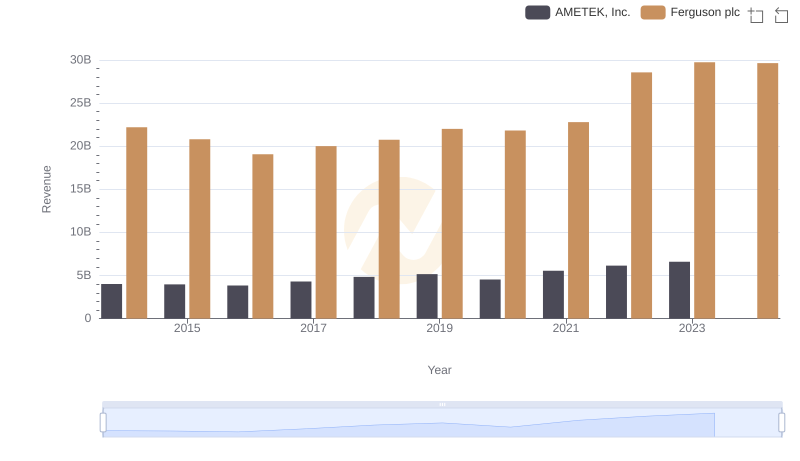
Revenue Insights: AMETEK, Inc. and Ferguson plc Performance Compared
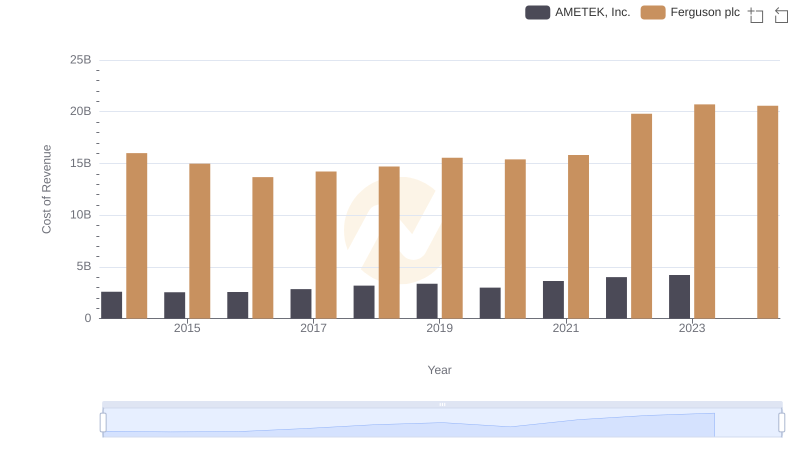
AMETEK, Inc. vs Ferguson plc: Efficiency in Cost of Revenue Explored
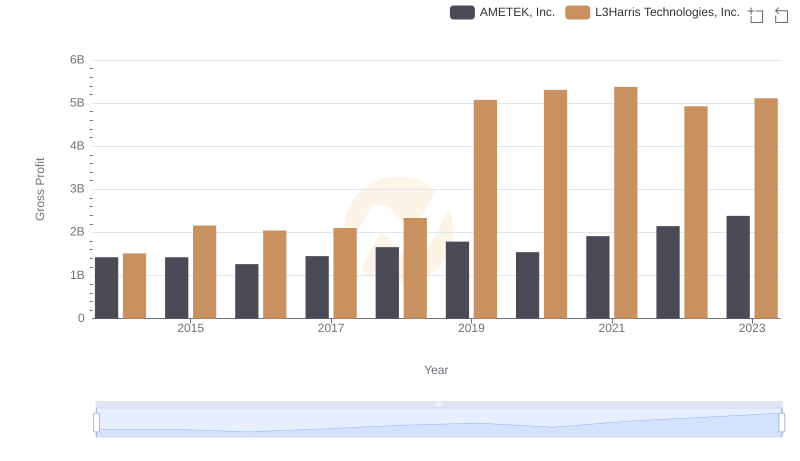
AMETEK, Inc. vs L3Harris Technologies, Inc.: A Gross Profit Performance Breakdown
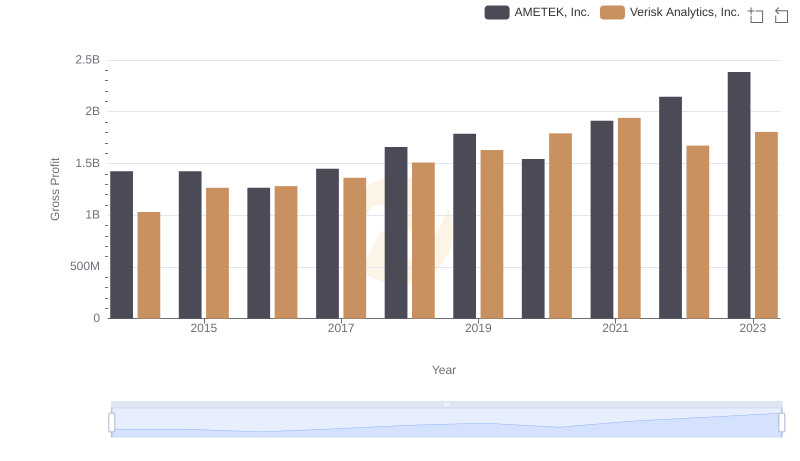
AMETEK, Inc. and Verisk Analytics, Inc.: A Detailed Gross Profit Analysis
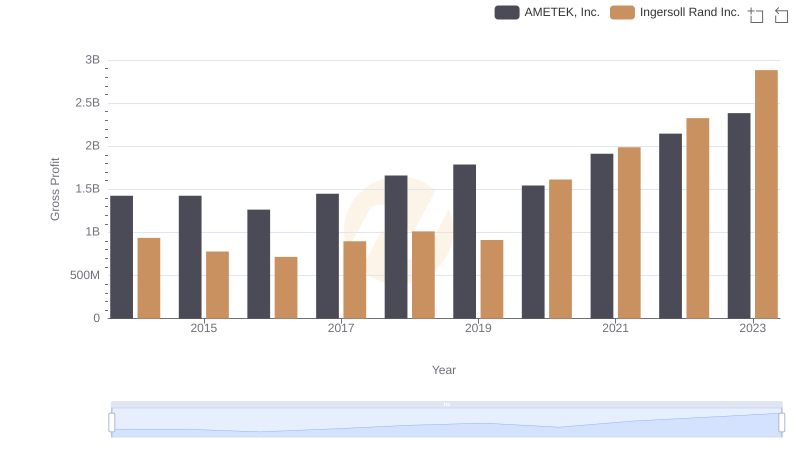
Gross Profit Comparison: AMETEK, Inc. and Ingersoll Rand Inc. Trends
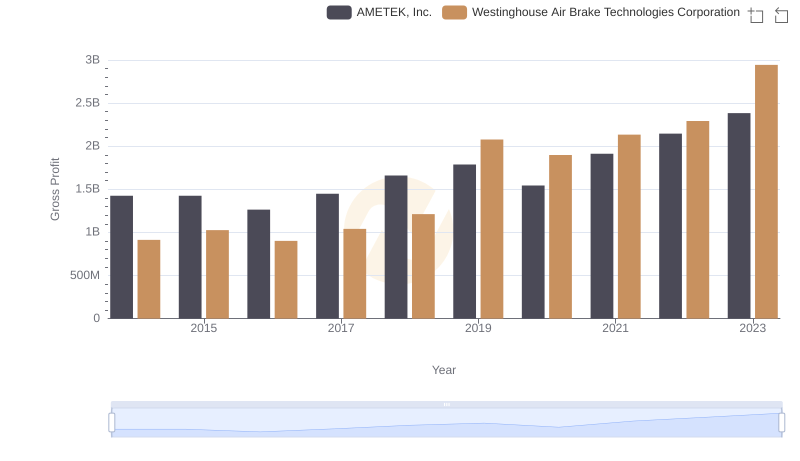
Gross Profit Trends Compared: AMETEK, Inc. vs Westinghouse Air Brake Technologies Corporation
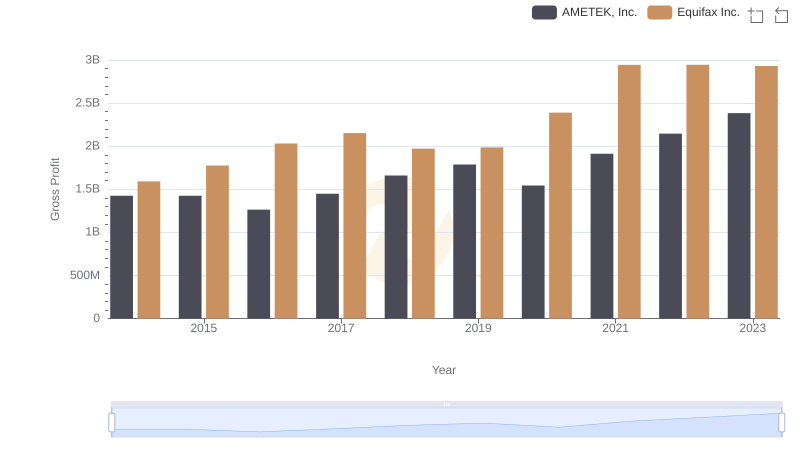
Gross Profit Trends Compared: AMETEK, Inc. vs Equifax Inc.
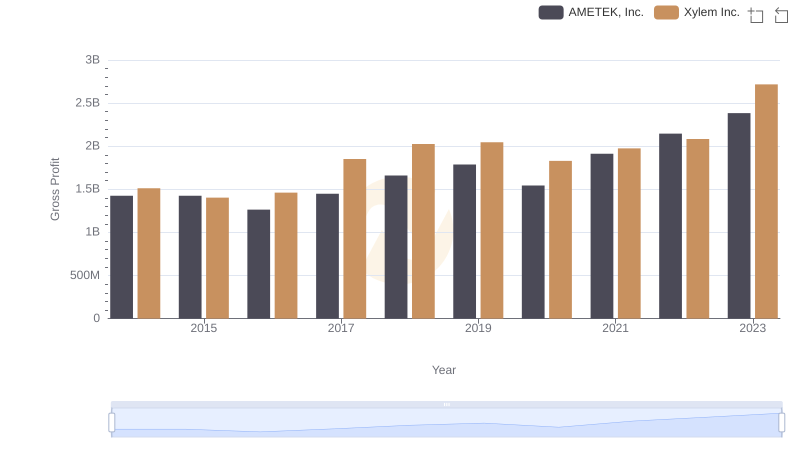
AMETEK, Inc. vs Xylem Inc.: A Gross Profit Performance Breakdown

Key Insights on Gross Profit: AMETEK, Inc. vs Ferrovial SE
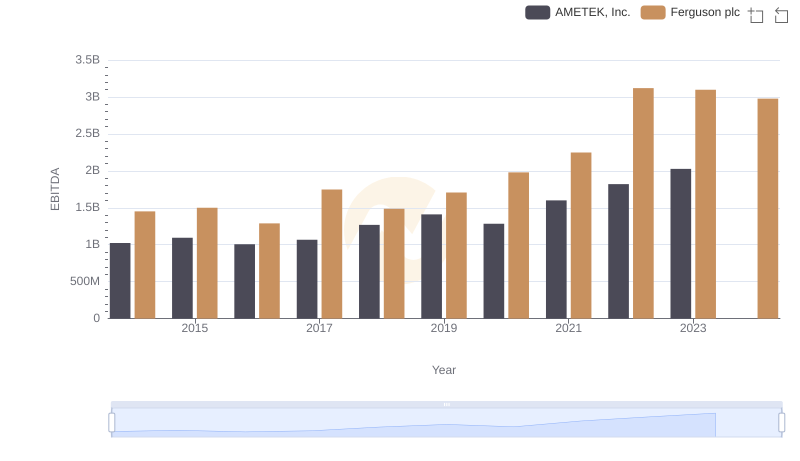
A Side-by-Side Analysis of EBITDA: AMETEK, Inc. and Ferguson plc