| __timestamp | AMETEK, Inc. | L3Harris Technologies, Inc. |
|---|---|---|
| Wednesday, January 1, 2014 | 1424947000 | 1515000000 |
| Thursday, January 1, 2015 | 1425015000 | 2160000000 |
| Friday, January 1, 2016 | 1264867000 | 2043000000 |
| Sunday, January 1, 2017 | 1448739000 | 2102000000 |
| Monday, January 1, 2018 | 1659562000 | 2334000000 |
| Tuesday, January 1, 2019 | 1787660000 | 5074000000 |
| Wednesday, January 1, 2020 | 1543514000 | 5308000000 |
| Friday, January 1, 2021 | 1912614000 | 5376000000 |
| Saturday, January 1, 2022 | 2145269000 | 4927000000 |
| Sunday, January 1, 2023 | 2384465001 | 5113000000 |
| Monday, January 1, 2024 | 6941180000 | 5524000000 |
Igniting the spark of knowledge
In the competitive landscape of industrial technology and defense, AMETEK, Inc. and L3Harris Technologies, Inc. have showcased remarkable growth in gross profit over the past decade. From 2014 to 2023, AMETEK's gross profit surged by approximately 67%, reflecting its strategic expansions and innovations. Meanwhile, L3Harris, a key player in defense technology, saw its gross profit more than triple, underscoring its dominance in the sector.
These trends not only reflect the companies' financial health but also their strategic positioning in their respective industries.
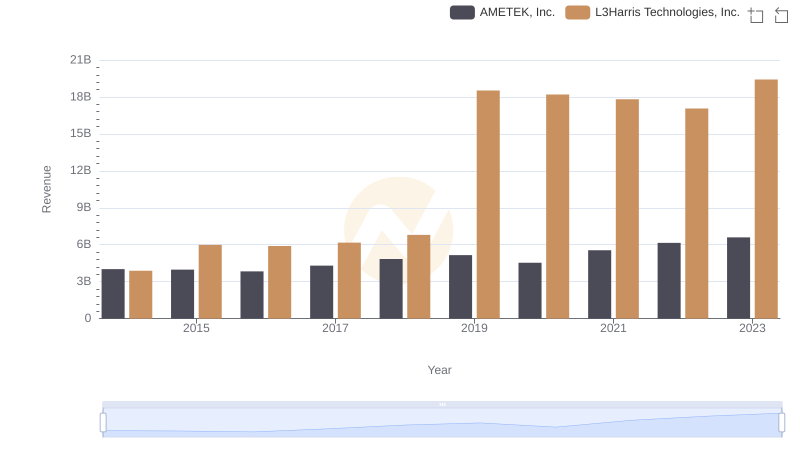
Revenue Showdown: AMETEK, Inc. vs L3Harris Technologies, Inc.
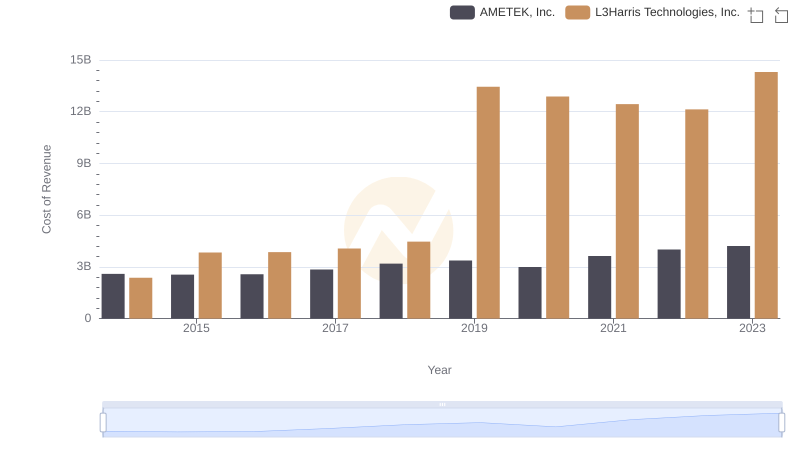
Cost Insights: Breaking Down AMETEK, Inc. and L3Harris Technologies, Inc.'s Expenses
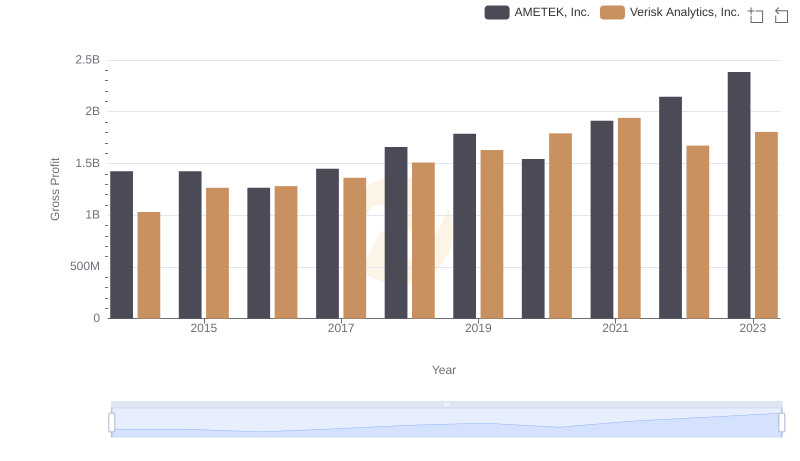
AMETEK, Inc. and Verisk Analytics, Inc.: A Detailed Gross Profit Analysis
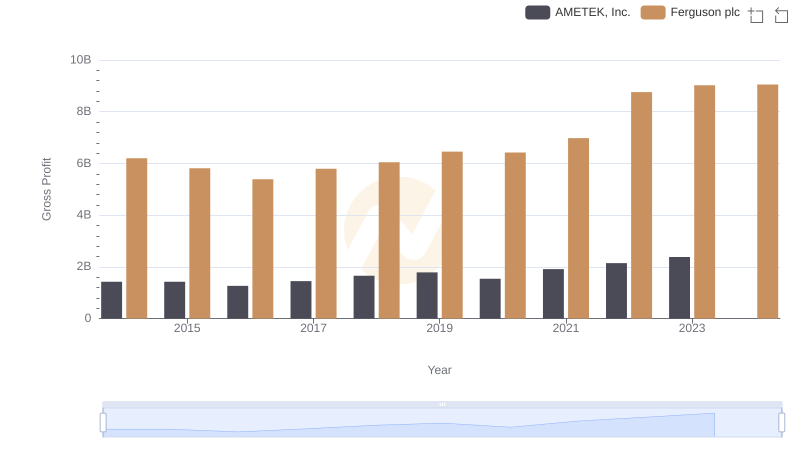
Key Insights on Gross Profit: AMETEK, Inc. vs Ferguson plc
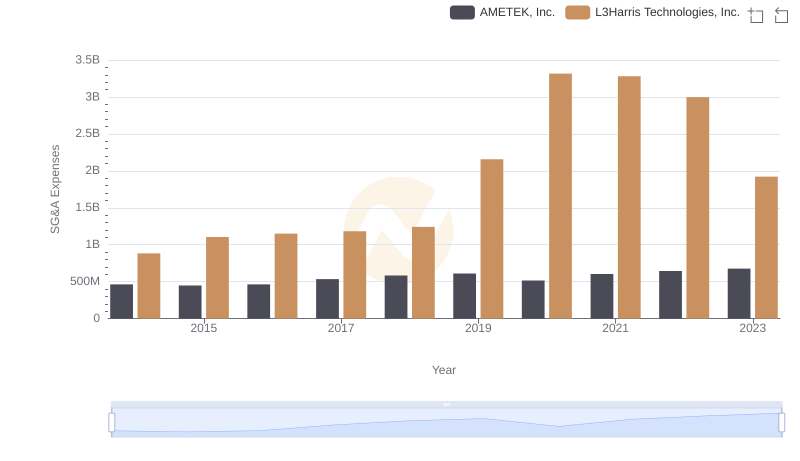
Operational Costs Compared: SG&A Analysis of AMETEK, Inc. and L3Harris Technologies, Inc.
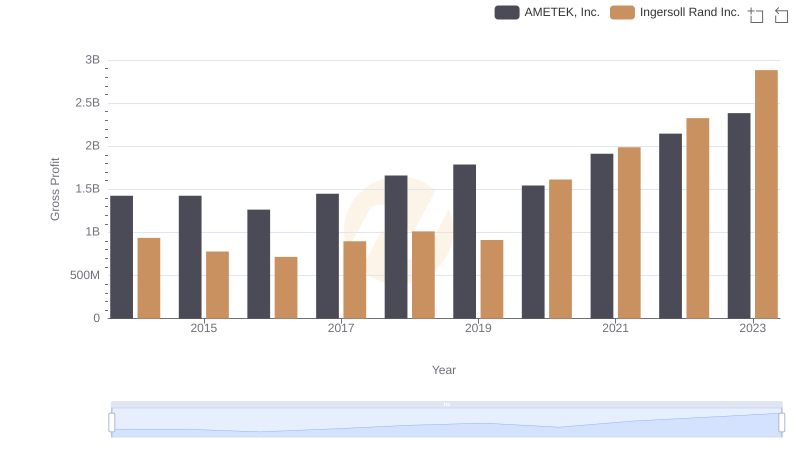
Gross Profit Comparison: AMETEK, Inc. and Ingersoll Rand Inc. Trends
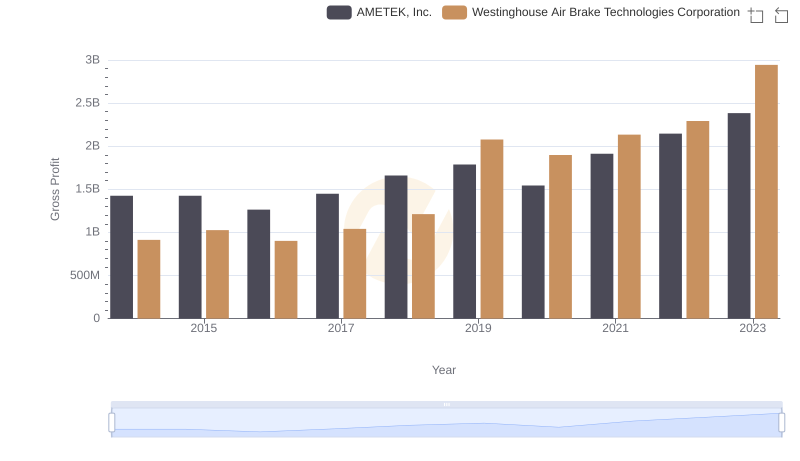
Gross Profit Trends Compared: AMETEK, Inc. vs Westinghouse Air Brake Technologies Corporation
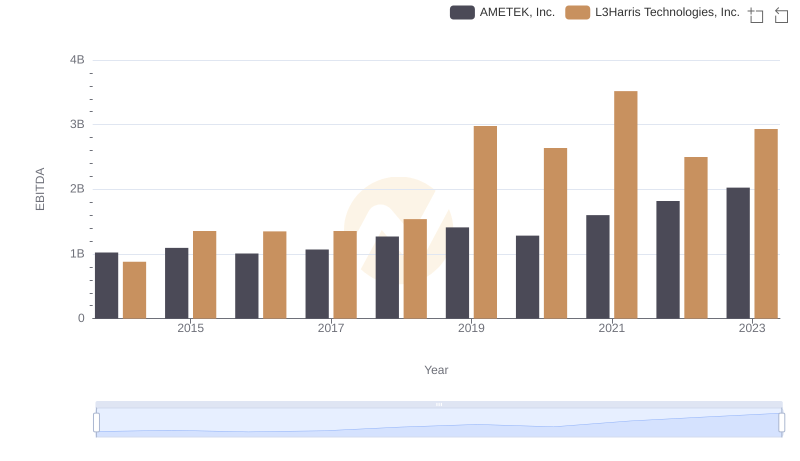
Professional EBITDA Benchmarking: AMETEK, Inc. vs L3Harris Technologies, Inc.
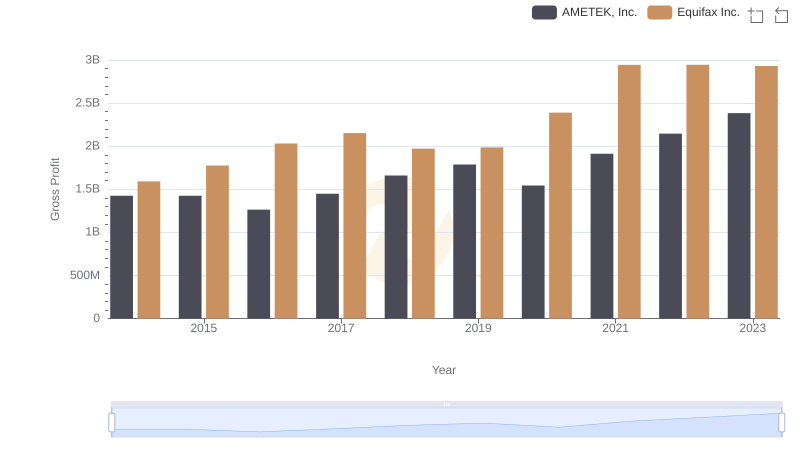
Gross Profit Trends Compared: AMETEK, Inc. vs Equifax Inc.
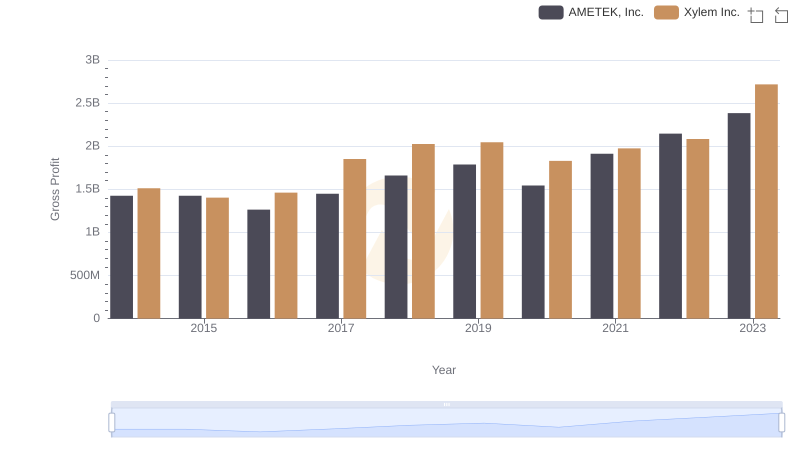
AMETEK, Inc. vs Xylem Inc.: A Gross Profit Performance Breakdown

Key Insights on Gross Profit: AMETEK, Inc. vs Ferrovial SE