| __timestamp | AMETEK, Inc. | Verisk Analytics, Inc. |
|---|---|---|
| Wednesday, January 1, 2014 | 1424947000 | 1030128000 |
| Thursday, January 1, 2015 | 1425015000 | 1264736000 |
| Friday, January 1, 2016 | 1264867000 | 1280800000 |
| Sunday, January 1, 2017 | 1448739000 | 1361400000 |
| Monday, January 1, 2018 | 1659562000 | 1508900000 |
| Tuesday, January 1, 2019 | 1787660000 | 1630300000 |
| Wednesday, January 1, 2020 | 1543514000 | 1790700000 |
| Friday, January 1, 2021 | 1912614000 | 1940800000 |
| Saturday, January 1, 2022 | 2145269000 | 1672400000 |
| Sunday, January 1, 2023 | 2384465001 | 1804900000 |
| Monday, January 1, 2024 | 6941180000 |
Cracking the code
In the ever-evolving landscape of the American stock market, AMETEK, Inc. and Verisk Analytics, Inc. have emerged as formidable players. Over the past decade, from 2014 to 2023, these companies have demonstrated remarkable growth in their gross profits, reflecting their strategic prowess and market adaptability.
AMETEK, Inc. has shown a consistent upward trajectory, with its gross profit increasing by approximately 67% over the ten-year period. This growth underscores AMETEK's robust business model and its ability to capitalize on market opportunities.
Verisk Analytics, Inc. has also experienced significant growth, with a 75% increase in gross profit from 2014 to 2023. This impressive performance highlights Verisk's innovative approach and its commitment to delivering value to its stakeholders.
Both companies have navigated the challenges of the past decade with resilience, making them key players to watch in the coming years.
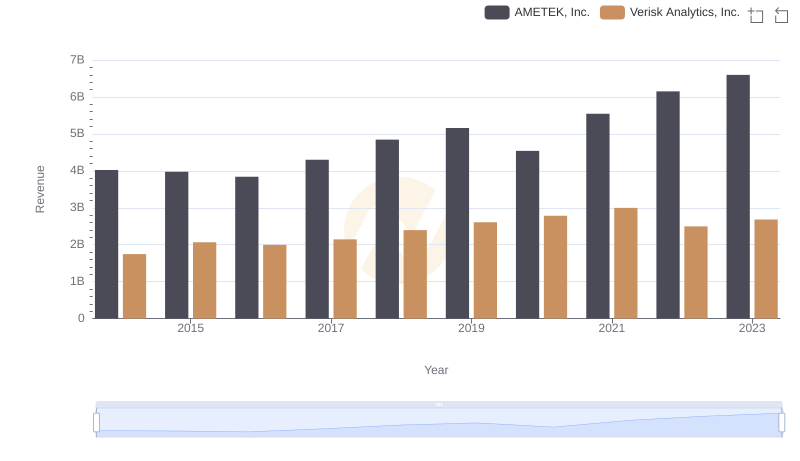
AMETEK, Inc. vs Verisk Analytics, Inc.: Examining Key Revenue Metrics
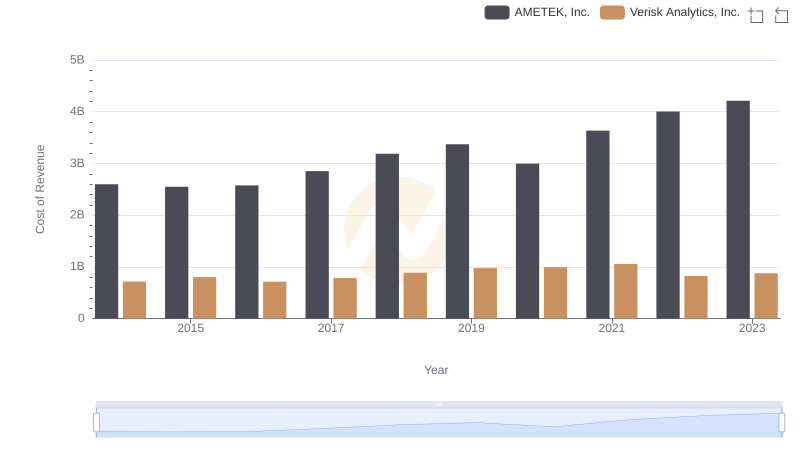
Cost of Revenue Comparison: AMETEK, Inc. vs Verisk Analytics, Inc.
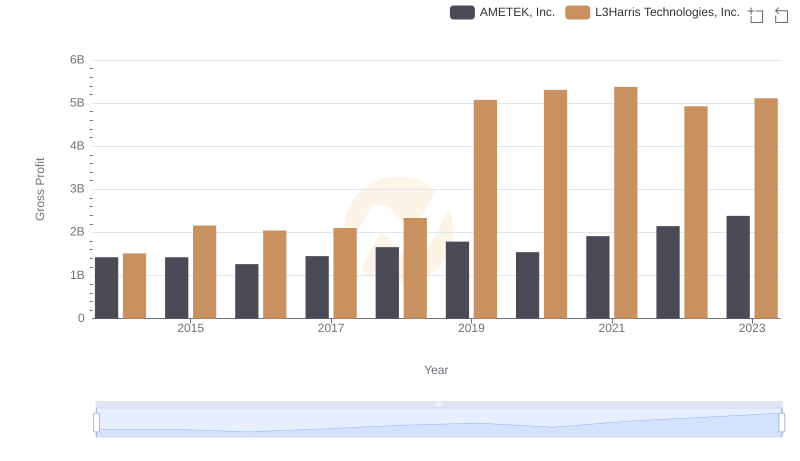
AMETEK, Inc. vs L3Harris Technologies, Inc.: A Gross Profit Performance Breakdown
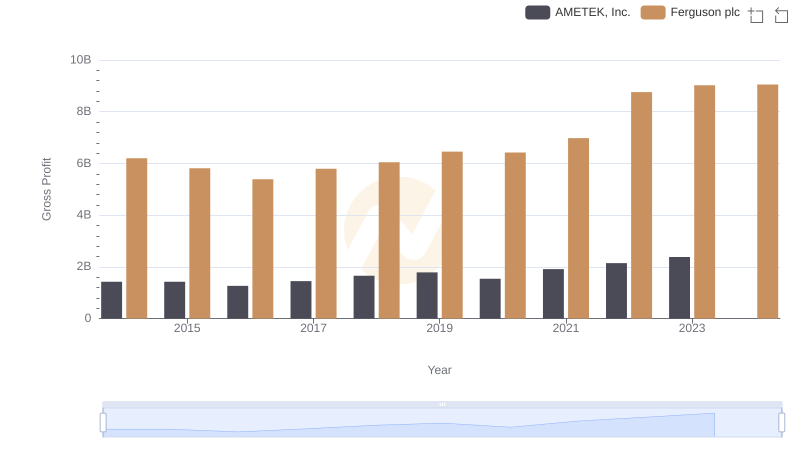
Key Insights on Gross Profit: AMETEK, Inc. vs Ferguson plc
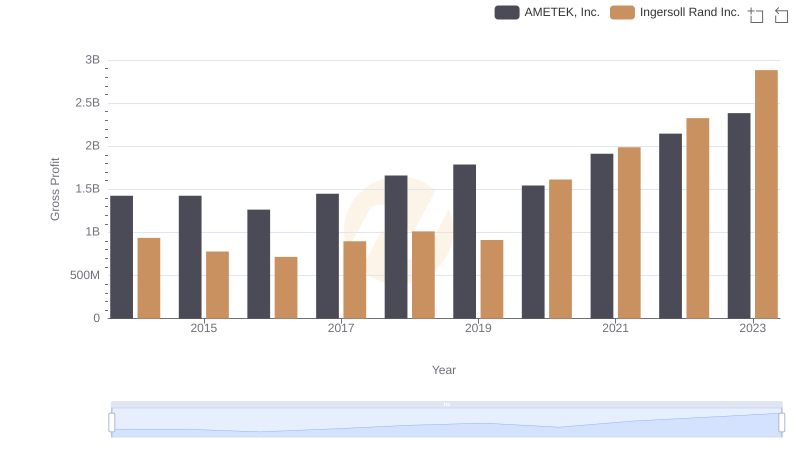
Gross Profit Comparison: AMETEK, Inc. and Ingersoll Rand Inc. Trends
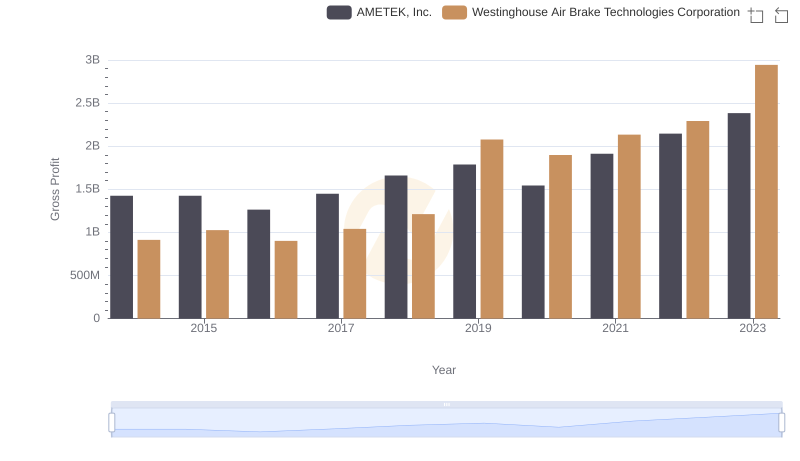
Gross Profit Trends Compared: AMETEK, Inc. vs Westinghouse Air Brake Technologies Corporation
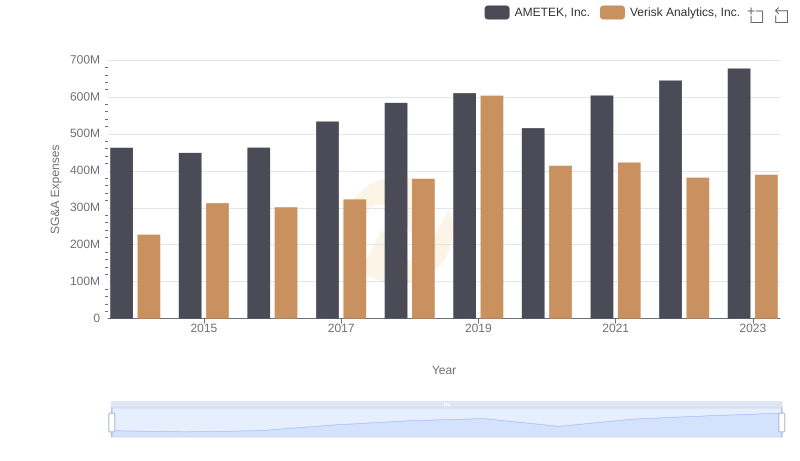
Comparing SG&A Expenses: AMETEK, Inc. vs Verisk Analytics, Inc. Trends and Insights
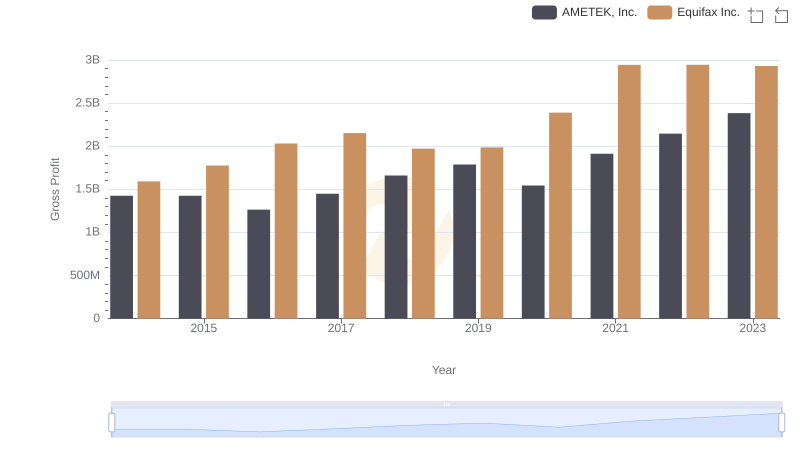
Gross Profit Trends Compared: AMETEK, Inc. vs Equifax Inc.
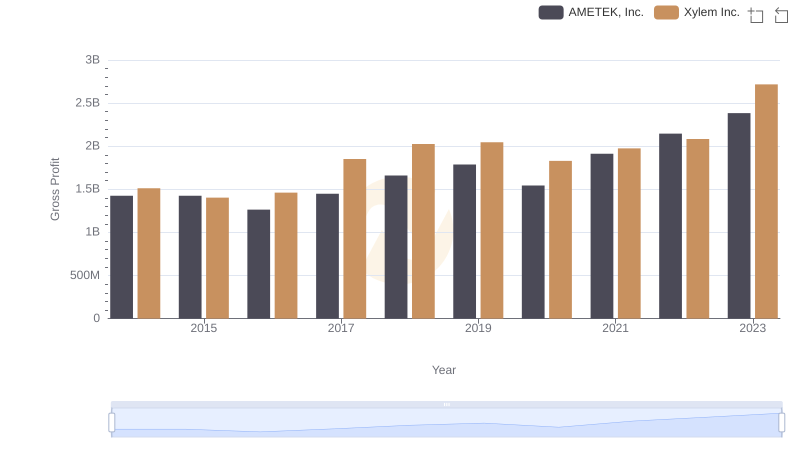
AMETEK, Inc. vs Xylem Inc.: A Gross Profit Performance Breakdown
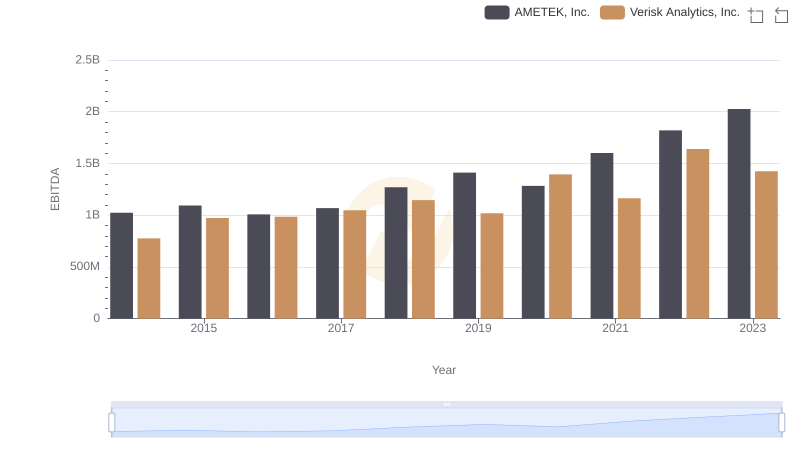
Professional EBITDA Benchmarking: AMETEK, Inc. vs Verisk Analytics, Inc.

Key Insights on Gross Profit: AMETEK, Inc. vs Ferrovial SE