| __timestamp | AMETEK, Inc. | Ingersoll Rand Inc. |
|---|---|---|
| Wednesday, January 1, 2014 | 1424947000 | 936781000 |
| Thursday, January 1, 2015 | 1425015000 | 779100000 |
| Friday, January 1, 2016 | 1264867000 | 716731000 |
| Sunday, January 1, 2017 | 1448739000 | 897900000 |
| Monday, January 1, 2018 | 1659562000 | 1012500000 |
| Tuesday, January 1, 2019 | 1787660000 | 911700000 |
| Wednesday, January 1, 2020 | 1543514000 | 1613400000 |
| Friday, January 1, 2021 | 1912614000 | 1988500000 |
| Saturday, January 1, 2022 | 2145269000 | 2325600000 |
| Sunday, January 1, 2023 | 2384465001 | 2882200000 |
| Monday, January 1, 2024 | 6941180000 | 0 |
Cracking the code
In the ever-evolving landscape of industrial manufacturing, AMETEK, Inc. and Ingersoll Rand Inc. have emerged as formidable players. Over the past decade, these companies have demonstrated remarkable growth in gross profit, reflecting their strategic prowess and market adaptability.
From 2014 to 2023, AMETEK, Inc. has seen its gross profit soar by approximately 67%, showcasing a consistent upward trajectory. This growth underscores AMETEK's commitment to innovation and efficiency, positioning it as a leader in the industry.
Ingersoll Rand Inc. has experienced an even more impressive rise, with its gross profit nearly tripling over the same period. This surge highlights the company's successful expansion strategies and its ability to capitalize on emerging market opportunities.
Both companies exemplify resilience and strategic foresight, making them key players to watch in the industrial sector.
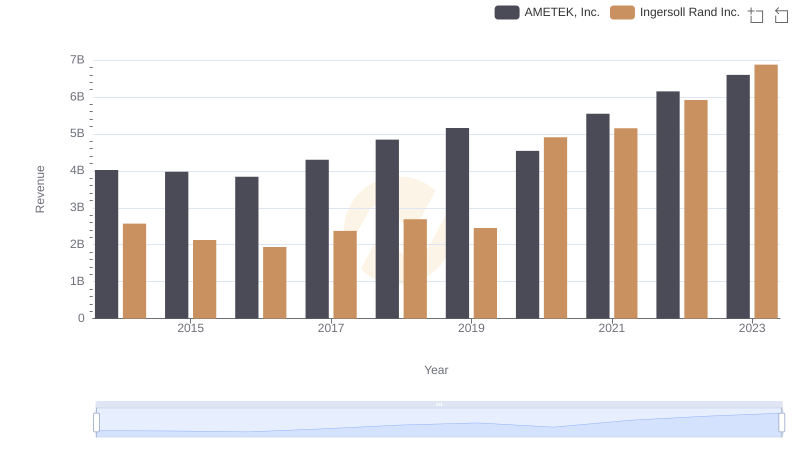
Breaking Down Revenue Trends: AMETEK, Inc. vs Ingersoll Rand Inc.
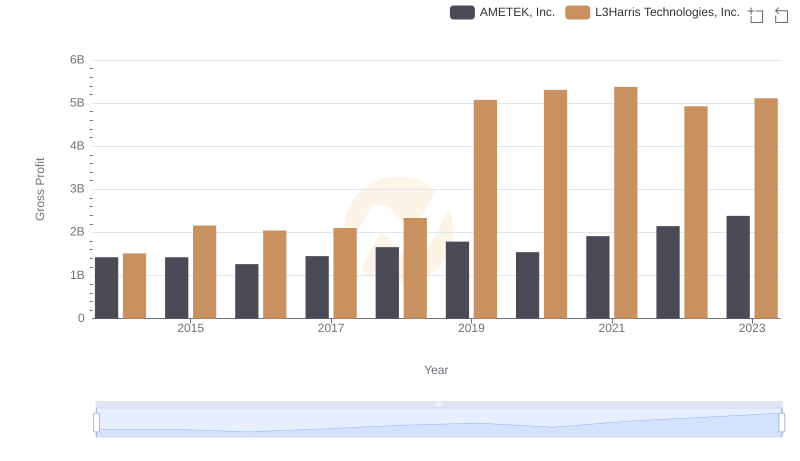
AMETEK, Inc. vs L3Harris Technologies, Inc.: A Gross Profit Performance Breakdown
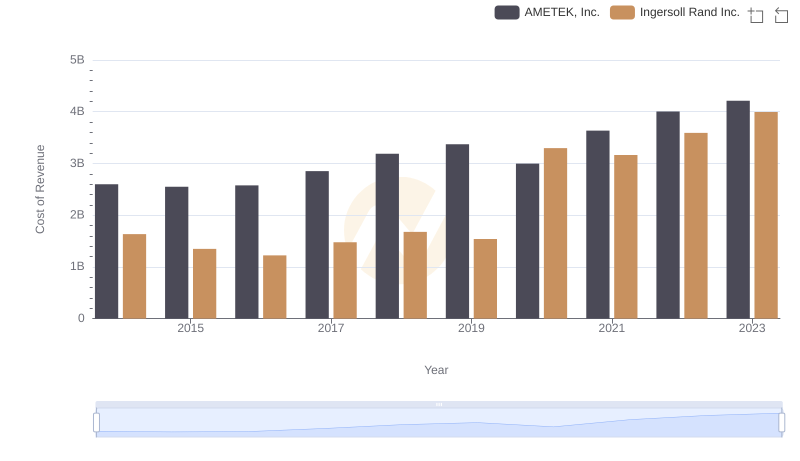
Cost of Revenue: Key Insights for AMETEK, Inc. and Ingersoll Rand Inc.
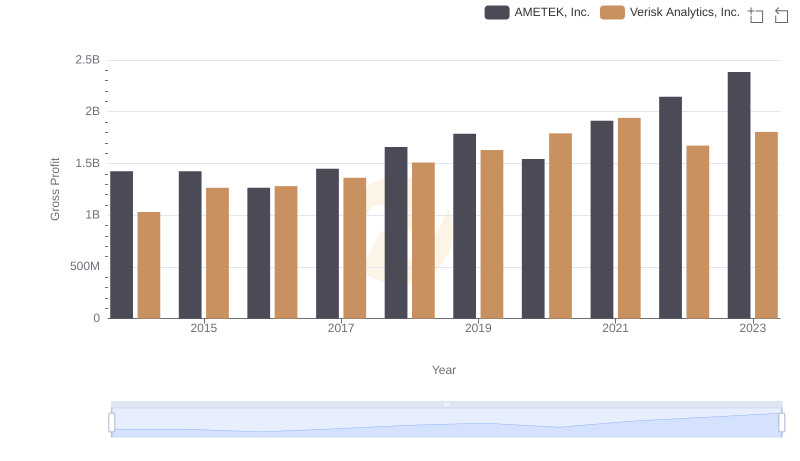
AMETEK, Inc. and Verisk Analytics, Inc.: A Detailed Gross Profit Analysis
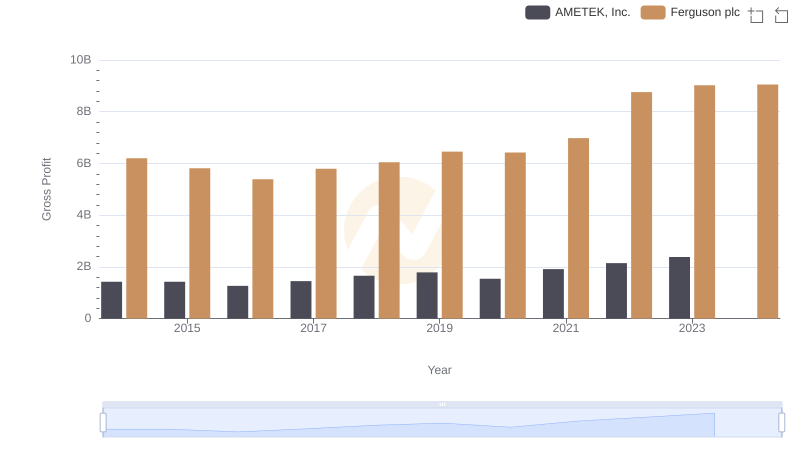
Key Insights on Gross Profit: AMETEK, Inc. vs Ferguson plc
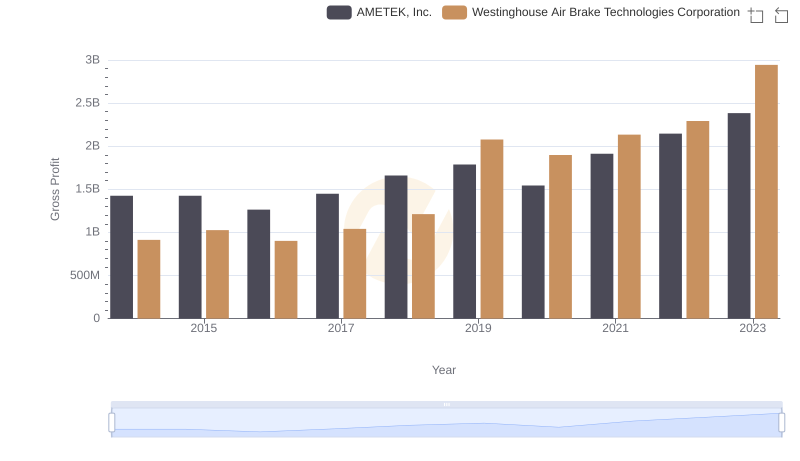
Gross Profit Trends Compared: AMETEK, Inc. vs Westinghouse Air Brake Technologies Corporation
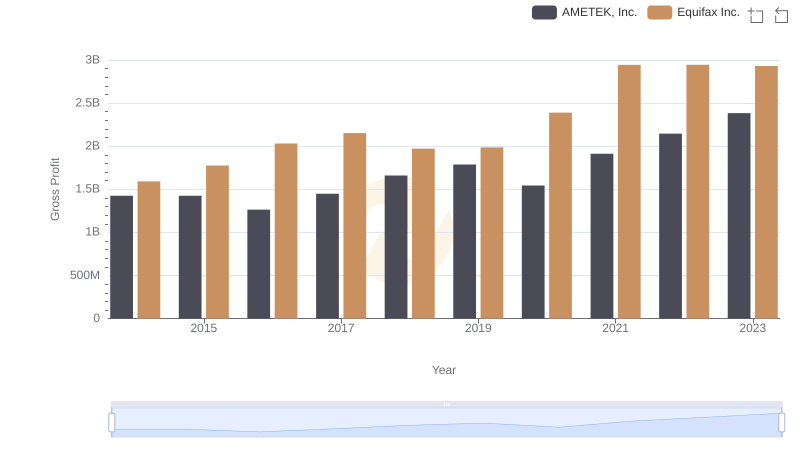
Gross Profit Trends Compared: AMETEK, Inc. vs Equifax Inc.
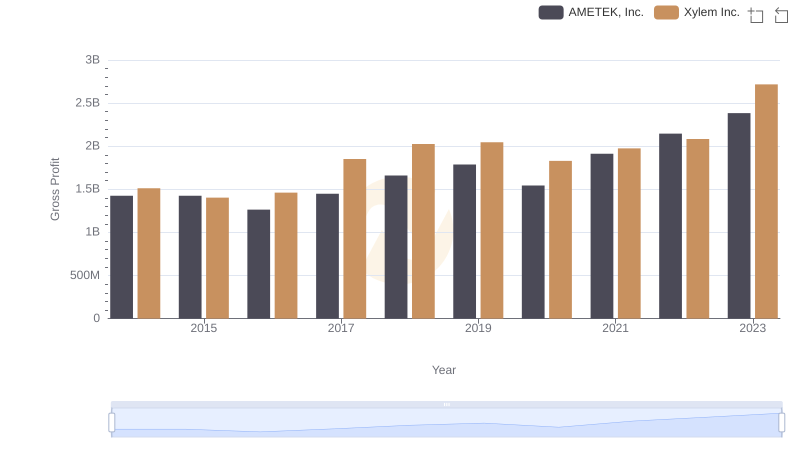
AMETEK, Inc. vs Xylem Inc.: A Gross Profit Performance Breakdown

Key Insights on Gross Profit: AMETEK, Inc. vs Ferrovial SE