| __timestamp | AMETEK, Inc. | Ferguson plc |
|---|---|---|
| Wednesday, January 1, 2014 | 1023344000 | 1450623023 |
| Thursday, January 1, 2015 | 1093776000 | 1500920522 |
| Friday, January 1, 2016 | 1007213000 | 1289082542 |
| Sunday, January 1, 2017 | 1068174000 | 1746753588 |
| Monday, January 1, 2018 | 1269415000 | 1487000000 |
| Tuesday, January 1, 2019 | 1411422000 | 1707000000 |
| Wednesday, January 1, 2020 | 1283159000 | 1979000000 |
| Friday, January 1, 2021 | 1600782000 | 2248000000 |
| Saturday, January 1, 2022 | 1820119000 | 3120000000 |
| Sunday, January 1, 2023 | 2025843000 | 3097000000 |
| Monday, January 1, 2024 | 1779562000 | 2978000000 |
Unlocking the unknown
In the ever-evolving landscape of industrial and building products, AMETEK, Inc. and Ferguson plc have emerged as formidable players. Over the past decade, these companies have demonstrated significant growth in their EBITDA, a key indicator of financial health. From 2014 to 2023, AMETEK, Inc. saw its EBITDA rise by approximately 98%, reflecting its robust operational efficiency and strategic expansions. Meanwhile, Ferguson plc experienced an impressive 113% increase, underscoring its strong market position and adaptability.
Notably, 2022 marked a peak year for Ferguson plc, with an EBITDA of over 3.1 billion, while AMETEK, Inc. reached its highest in 2023. However, data for AMETEK, Inc. in 2024 is missing, leaving room for speculation on its future trajectory. This side-by-side analysis offers a compelling glimpse into the financial prowess of these industry giants.
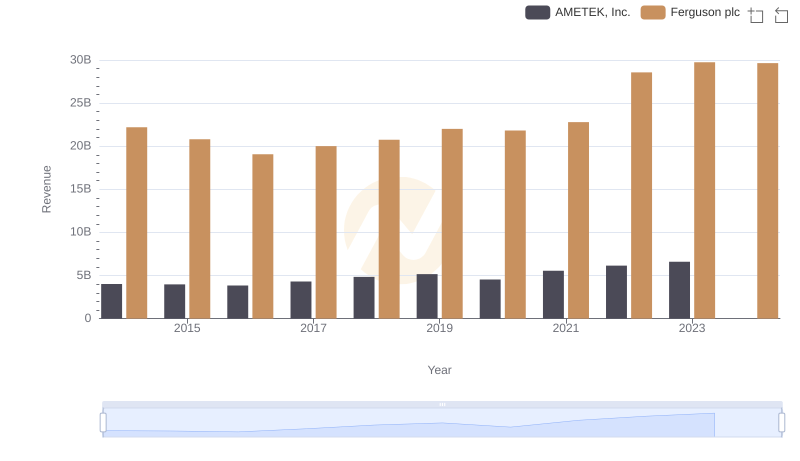
Revenue Insights: AMETEK, Inc. and Ferguson plc Performance Compared
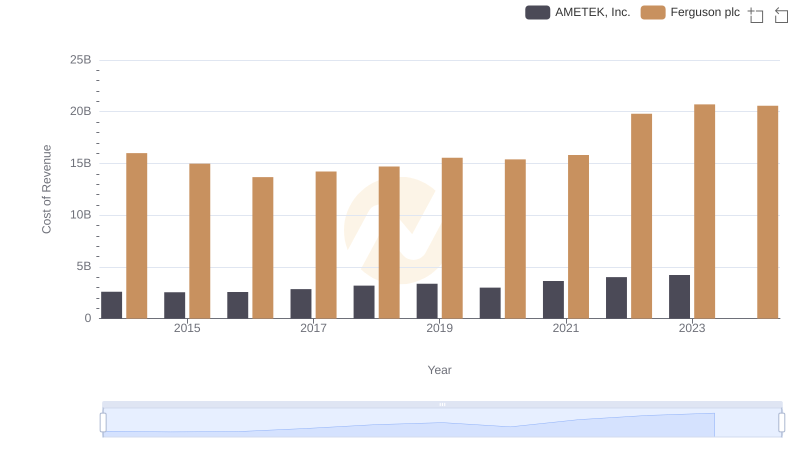
AMETEK, Inc. vs Ferguson plc: Efficiency in Cost of Revenue Explored
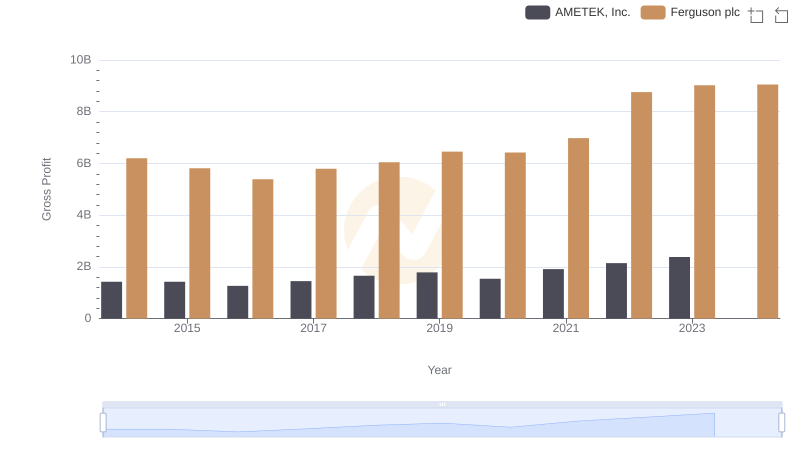
Key Insights on Gross Profit: AMETEK, Inc. vs Ferguson plc
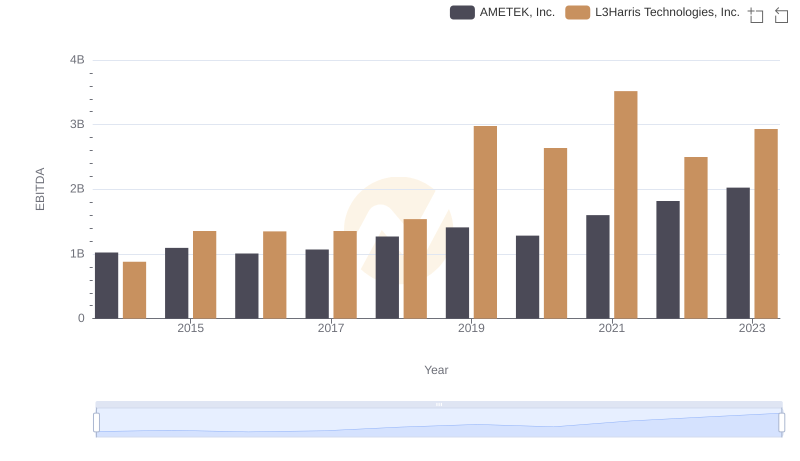
Professional EBITDA Benchmarking: AMETEK, Inc. vs L3Harris Technologies, Inc.
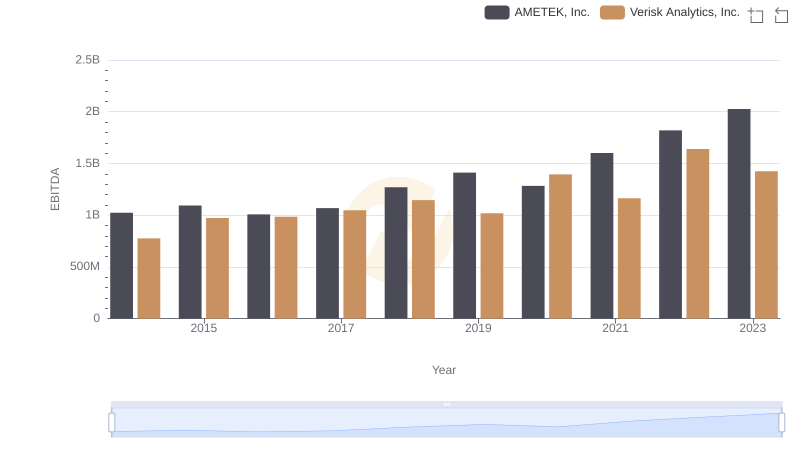
Professional EBITDA Benchmarking: AMETEK, Inc. vs Verisk Analytics, Inc.
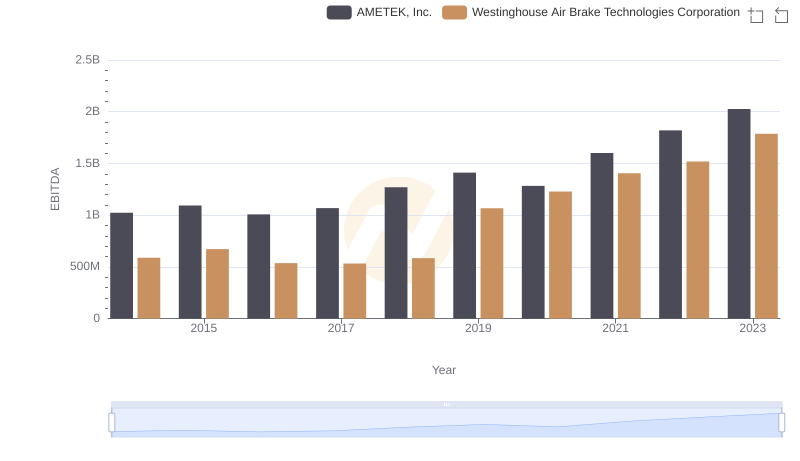
A Professional Review of EBITDA: AMETEK, Inc. Compared to Westinghouse Air Brake Technologies Corporation
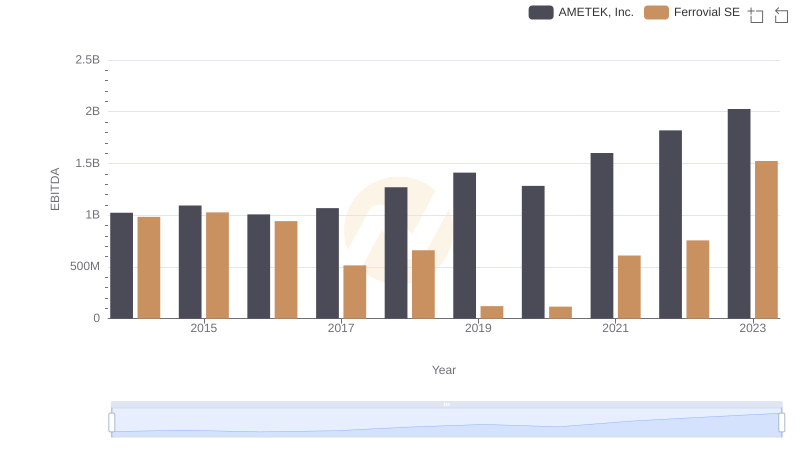
A Side-by-Side Analysis of EBITDA: AMETEK, Inc. and Ferrovial SE
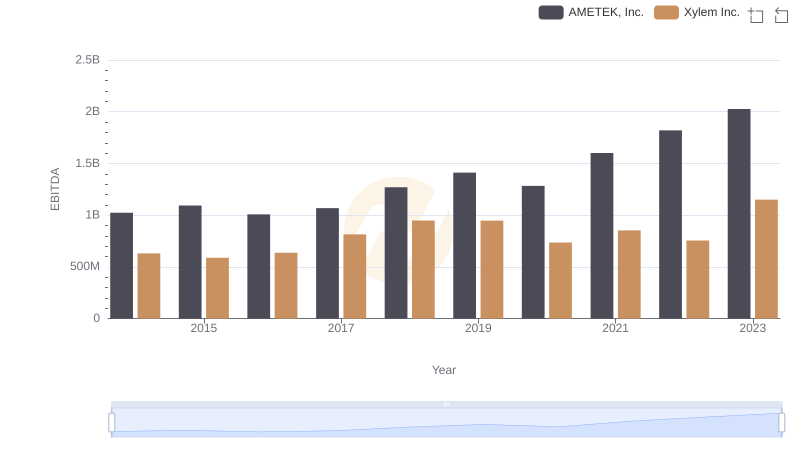
Professional EBITDA Benchmarking: AMETEK, Inc. vs Xylem Inc.
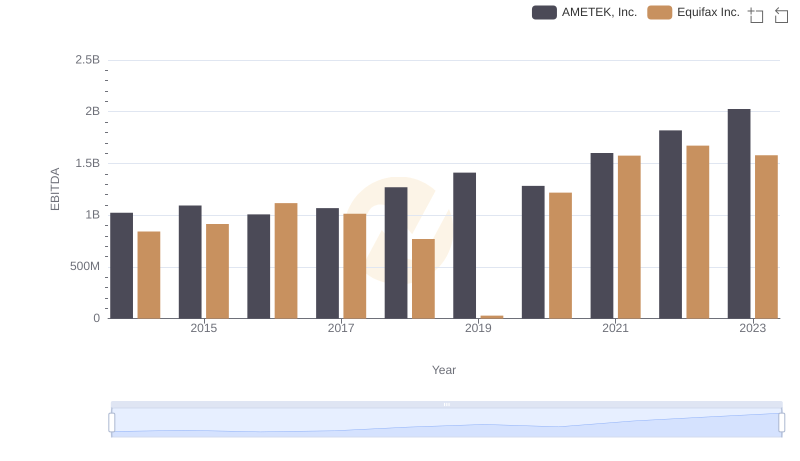
Comparative EBITDA Analysis: AMETEK, Inc. vs Equifax Inc.
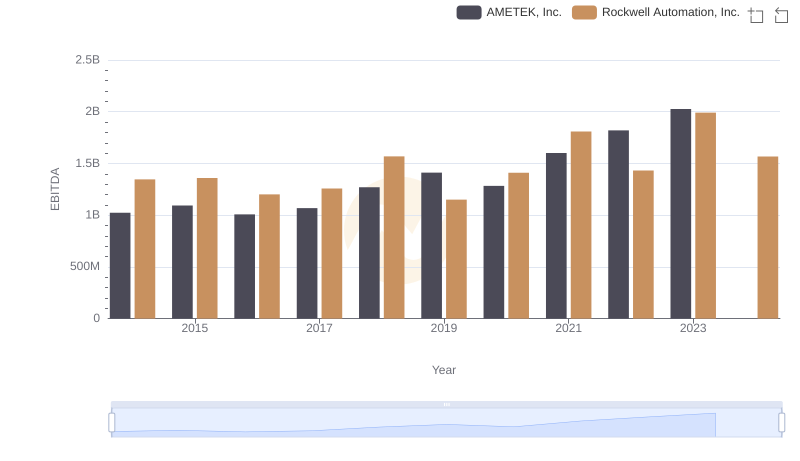
Professional EBITDA Benchmarking: AMETEK, Inc. vs Rockwell Automation, Inc.