| __timestamp | AMETEK, Inc. | Ferrovial SE |
|---|---|---|
| Wednesday, January 1, 2014 | 1424947000 | 7671000000 |
| Thursday, January 1, 2015 | 1425015000 | 8556000000 |
| Friday, January 1, 2016 | 1264867000 | 9491000000 |
| Sunday, January 1, 2017 | 1448739000 | 10864000000 |
| Monday, January 1, 2018 | 1659562000 | 4752000000 |
| Tuesday, January 1, 2019 | 1787660000 | 5105000000 |
| Wednesday, January 1, 2020 | 1543514000 | 5336000000 |
| Friday, January 1, 2021 | 1912614000 | 5701000000 |
| Saturday, January 1, 2022 | 2145269000 | 6354000000 |
| Sunday, January 1, 2023 | 2384465001 | 7385000000 |
| Monday, January 1, 2024 | 6941180000 |
Unleashing the power of data
In the ever-evolving landscape of global business, AMETEK, Inc. and Ferrovial SE stand as titans in their respective industries. Over the past decade, these companies have showcased remarkable resilience and growth, particularly in their gross profit margins. From 2014 to 2023, AMETEK, Inc. has seen a steady increase in gross profit, culminating in a 67% rise by 2023. This growth reflects the company's strategic investments and operational efficiencies.
Conversely, Ferrovial SE, a leader in infrastructure and mobility, experienced fluctuations in its gross profit, with a notable dip in 2018. However, by 2023, Ferrovial SE rebounded, achieving a 55% increase from its 2018 low. This recovery underscores the company's adaptability and commitment to innovation. As these two giants continue to evolve, their financial trajectories offer valuable insights into the dynamics of global commerce.
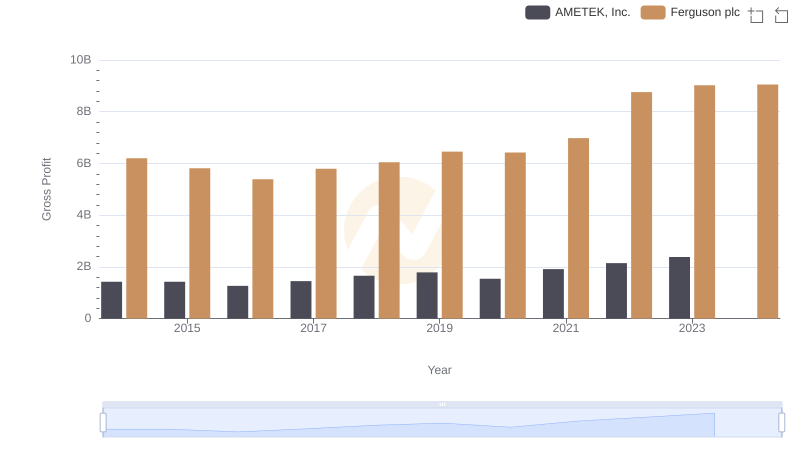
Key Insights on Gross Profit: AMETEK, Inc. vs Ferguson plc
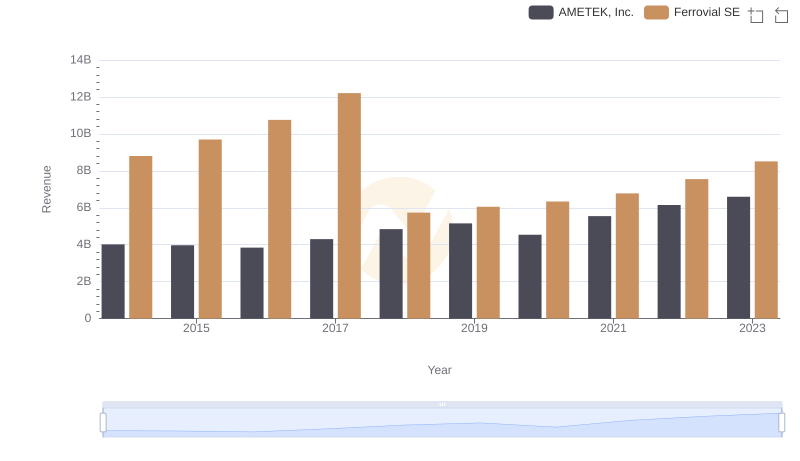
AMETEK, Inc. or Ferrovial SE: Who Leads in Yearly Revenue?
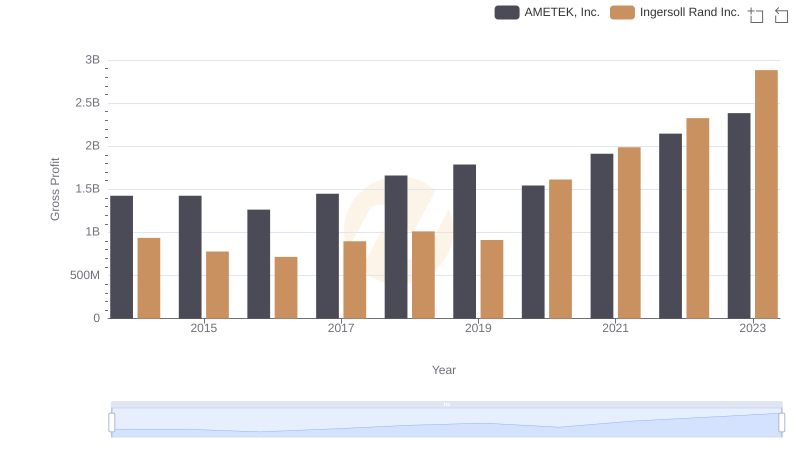
Gross Profit Comparison: AMETEK, Inc. and Ingersoll Rand Inc. Trends
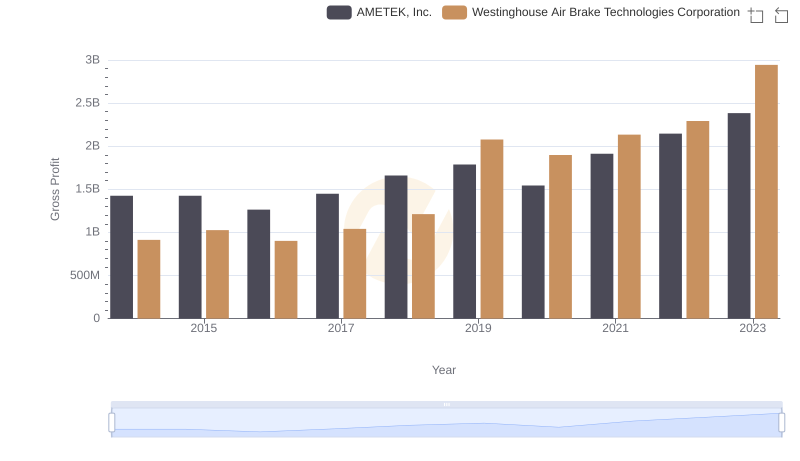
Gross Profit Trends Compared: AMETEK, Inc. vs Westinghouse Air Brake Technologies Corporation
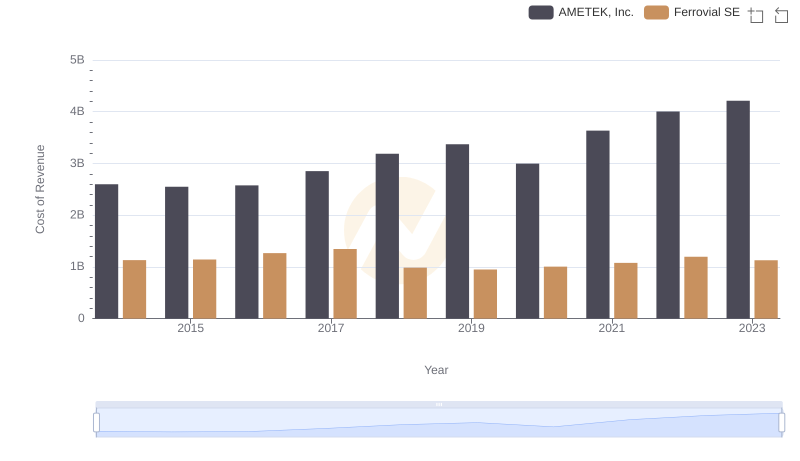
Cost of Revenue Trends: AMETEK, Inc. vs Ferrovial SE
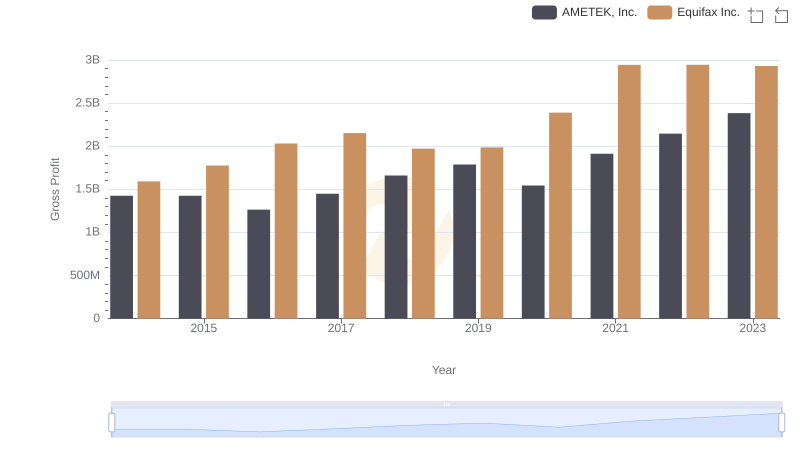
Gross Profit Trends Compared: AMETEK, Inc. vs Equifax Inc.
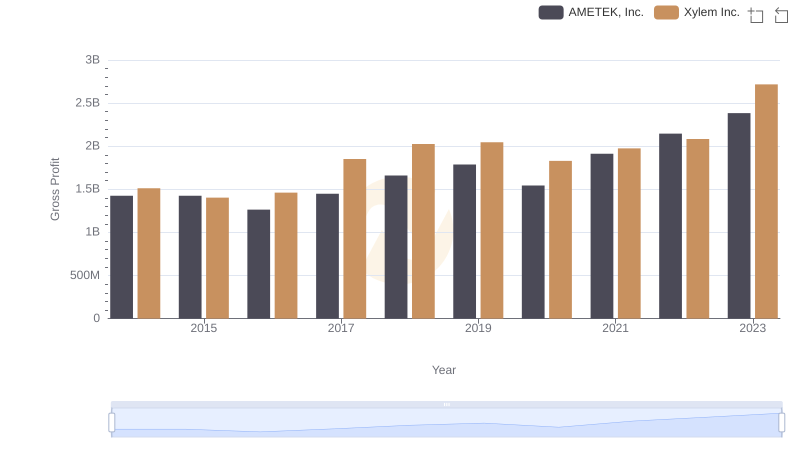
AMETEK, Inc. vs Xylem Inc.: A Gross Profit Performance Breakdown
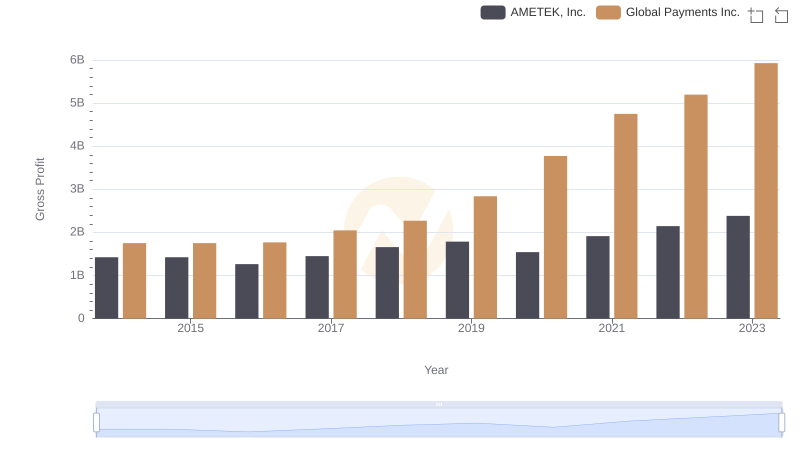
AMETEK, Inc. vs Global Payments Inc.: A Gross Profit Performance Breakdown
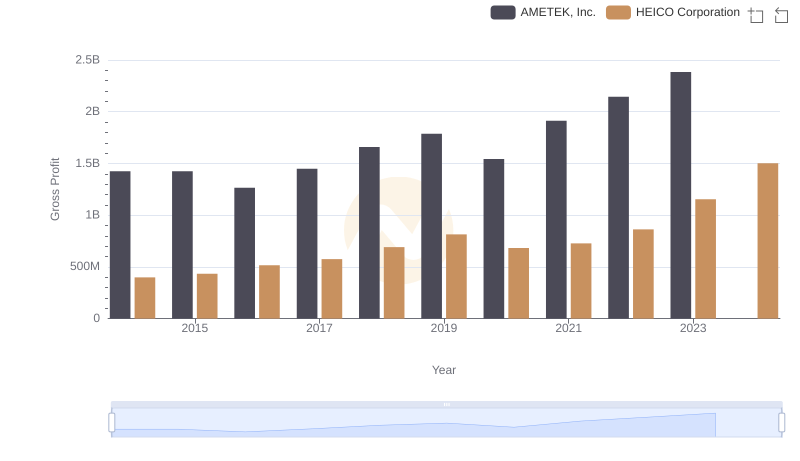
Gross Profit Trends Compared: AMETEK, Inc. vs HEICO Corporation
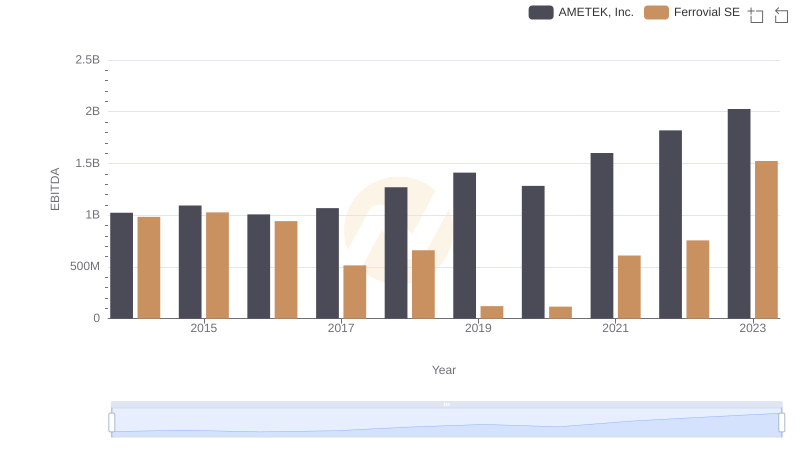
A Side-by-Side Analysis of EBITDA: AMETEK, Inc. and Ferrovial SE