| __timestamp | AMETEK, Inc. | Ferguson plc |
|---|---|---|
| Wednesday, January 1, 2014 | 2597017000 | 15995739428 |
| Thursday, January 1, 2015 | 2549280000 | 14984241894 |
| Friday, January 1, 2016 | 2575220000 | 13677144858 |
| Sunday, January 1, 2017 | 2851431000 | 14215866673 |
| Monday, January 1, 2018 | 3186310000 | 14708000000 |
| Tuesday, January 1, 2019 | 3370897000 | 15552000000 |
| Wednesday, January 1, 2020 | 2996515000 | 15398000000 |
| Friday, January 1, 2021 | 3633900000 | 15812000000 |
| Saturday, January 1, 2022 | 4005261000 | 19810000000 |
| Sunday, January 1, 2023 | 4212484999 | 20709000000 |
| Monday, January 1, 2024 | 0 | 20582000000 |
Unleashing the power of data
In the ever-evolving landscape of global business, cost efficiency remains a pivotal factor for success. This analysis delves into the cost of revenue trends for AMETEK, Inc. and Ferguson plc from 2014 to 2023. Over this decade, Ferguson plc consistently outpaced AMETEK, Inc. in terms of cost of revenue, with figures peaking at approximately $20.7 billion in 2023, marking a 29% increase from 2014. In contrast, AMETEK, Inc. saw a more modest growth of around 62% over the same period, reaching $4.2 billion in 2023. Notably, 2024 data for AMETEK, Inc. is missing, highlighting potential data gaps. This comparison underscores Ferguson plc's robust cost management strategies, while AMETEK, Inc. demonstrates steady growth. Such insights are invaluable for investors and analysts seeking to understand the financial dynamics of these industry giants.
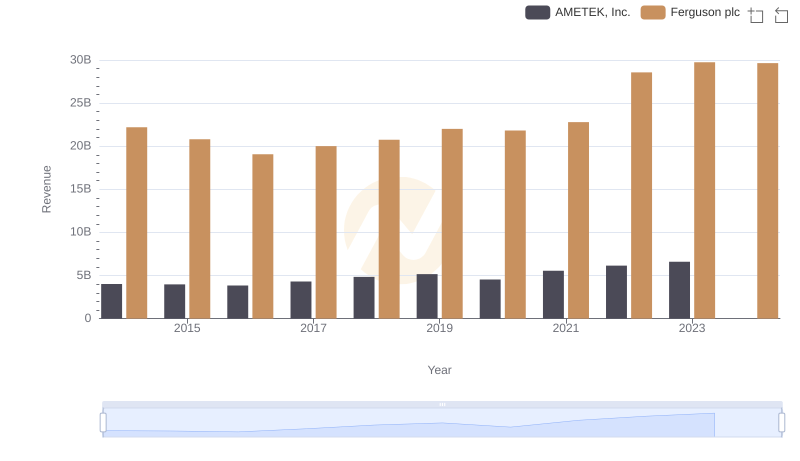
Revenue Insights: AMETEK, Inc. and Ferguson plc Performance Compared
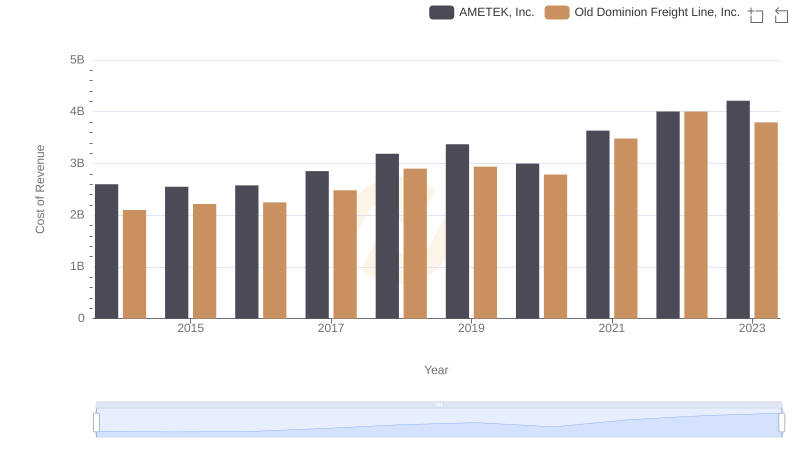
Cost of Revenue: Key Insights for AMETEK, Inc. and Old Dominion Freight Line, Inc.
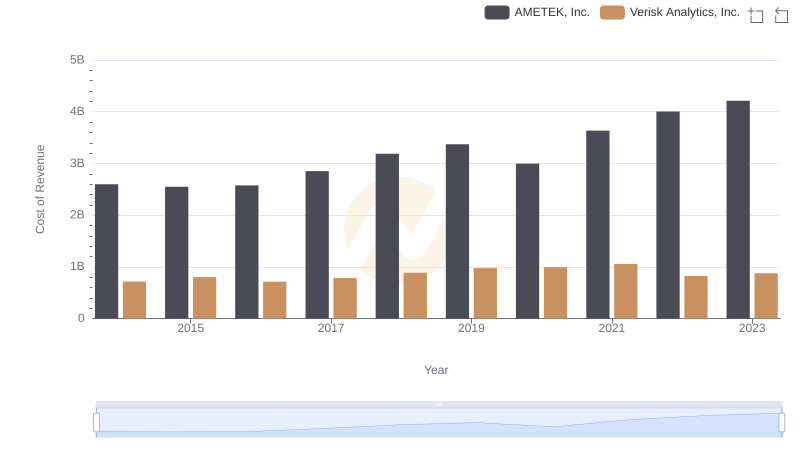
Cost of Revenue Comparison: AMETEK, Inc. vs Verisk Analytics, Inc.
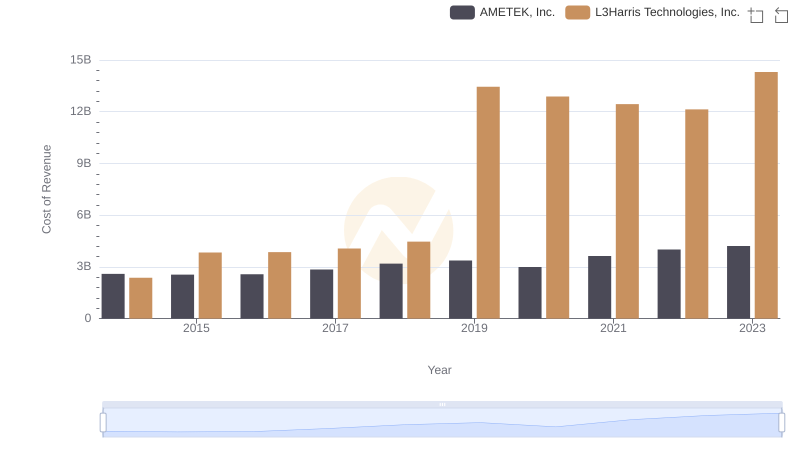
Cost Insights: Breaking Down AMETEK, Inc. and L3Harris Technologies, Inc.'s Expenses
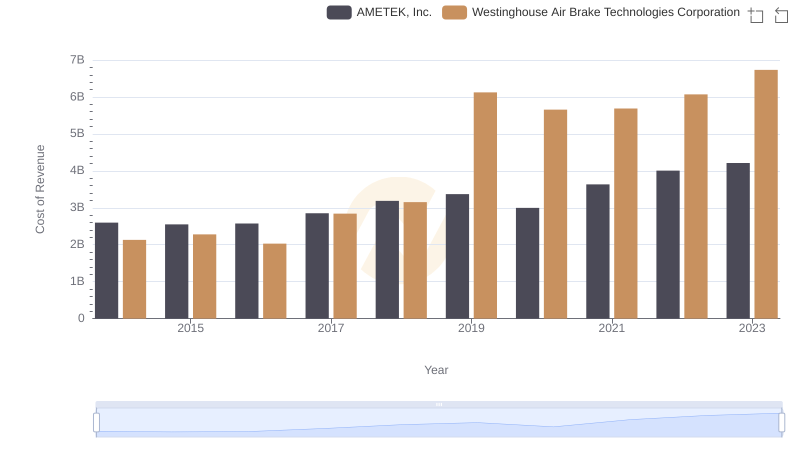
Cost Insights: Breaking Down AMETEK, Inc. and Westinghouse Air Brake Technologies Corporation's Expenses
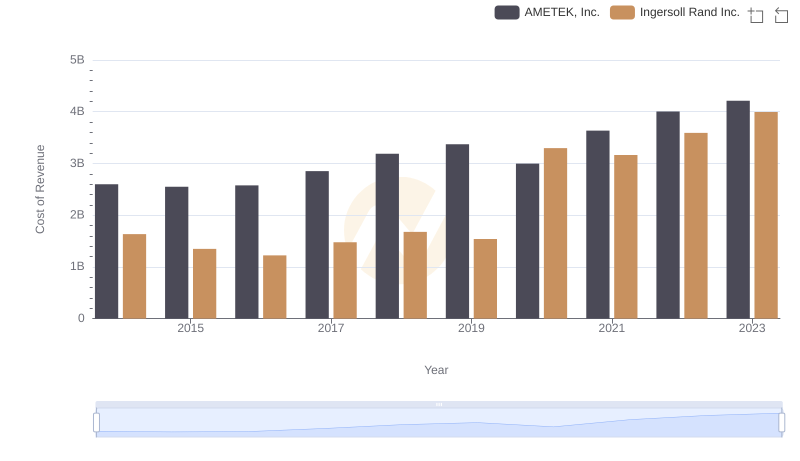
Cost of Revenue: Key Insights for AMETEK, Inc. and Ingersoll Rand Inc.
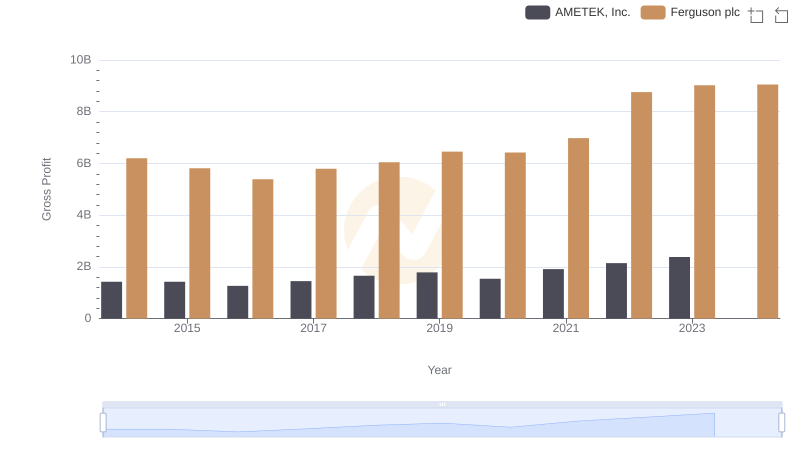
Key Insights on Gross Profit: AMETEK, Inc. vs Ferguson plc
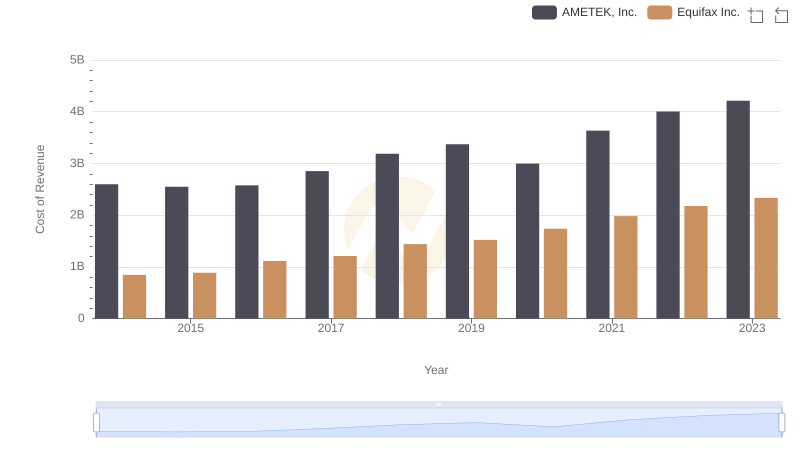
AMETEK, Inc. vs Equifax Inc.: Efficiency in Cost of Revenue Explored
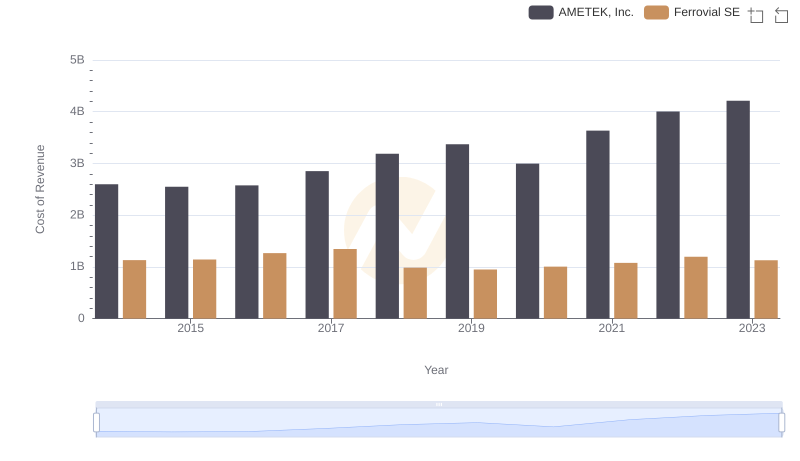
Cost of Revenue Trends: AMETEK, Inc. vs Ferrovial SE
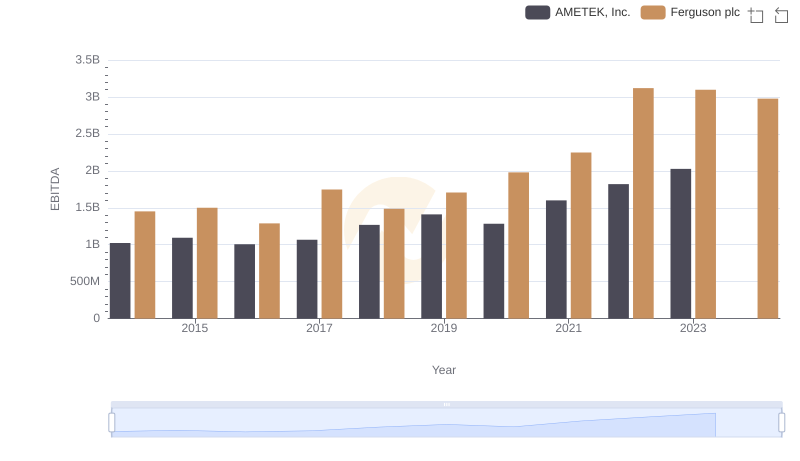
A Side-by-Side Analysis of EBITDA: AMETEK, Inc. and Ferguson plc