| __timestamp | AMETEK, Inc. | Ferguson plc |
|---|---|---|
| Wednesday, January 1, 2014 | 4021964000 | 22198928094 |
| Thursday, January 1, 2015 | 3974295000 | 20800698973 |
| Friday, January 1, 2016 | 3840087000 | 19066872795 |
| Sunday, January 1, 2017 | 4300170000 | 20009463224 |
| Monday, January 1, 2018 | 4845872000 | 20752000000 |
| Tuesday, January 1, 2019 | 5158557000 | 22010000000 |
| Wednesday, January 1, 2020 | 4540029000 | 21819000000 |
| Friday, January 1, 2021 | 5546514000 | 22792000000 |
| Saturday, January 1, 2022 | 6150530000 | 28566000000 |
| Sunday, January 1, 2023 | 6596950000 | 29734000000 |
| Monday, January 1, 2024 | 6941180000 | 29635000000 |
Igniting the spark of knowledge
In the ever-evolving landscape of global business, AMETEK, Inc. and Ferguson plc stand as titans in their respective industries. Over the past decade, these companies have demonstrated remarkable revenue trajectories, reflecting their strategic prowess and market adaptability.
From 2014 to 2023, AMETEK, Inc. has seen its revenue grow by approximately 64%, starting from $4 billion and reaching nearly $6.6 billion. This growth underscores AMETEK's commitment to innovation and operational excellence. Meanwhile, Ferguson plc, a leader in the distribution of plumbing and heating products, has experienced a steady revenue increase of about 34%, climbing from $22 billion to nearly $30 billion in the same period.
While AMETEK's revenue data for 2024 is not yet available, Ferguson plc continues its upward trend, albeit with a slight dip. This comparison highlights the dynamic nature of revenue growth strategies across different sectors.
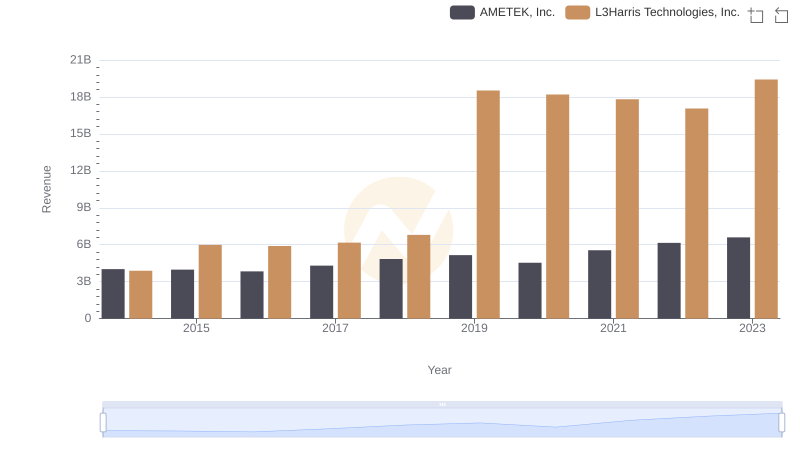
Revenue Showdown: AMETEK, Inc. vs L3Harris Technologies, Inc.
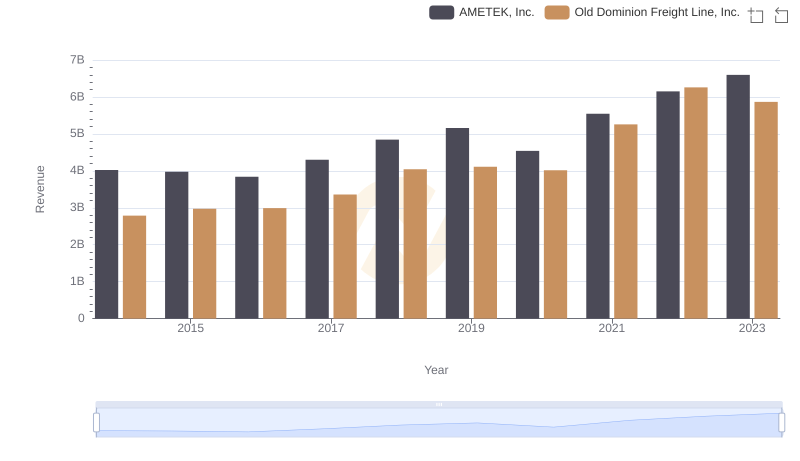
Revenue Insights: AMETEK, Inc. and Old Dominion Freight Line, Inc. Performance Compared
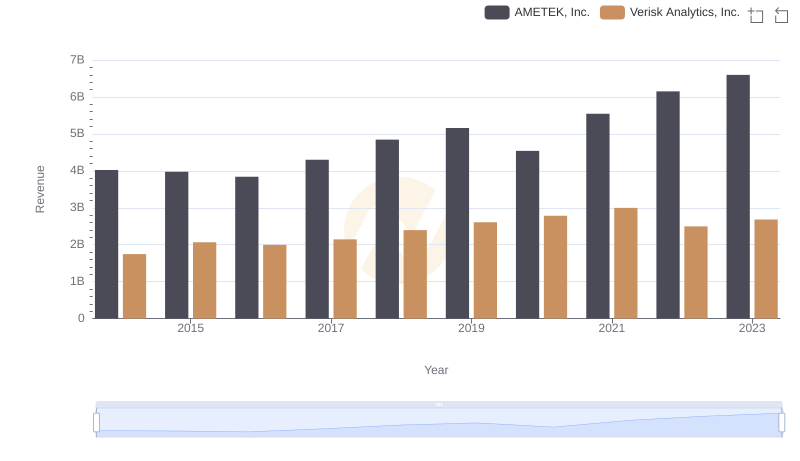
AMETEK, Inc. vs Verisk Analytics, Inc.: Examining Key Revenue Metrics
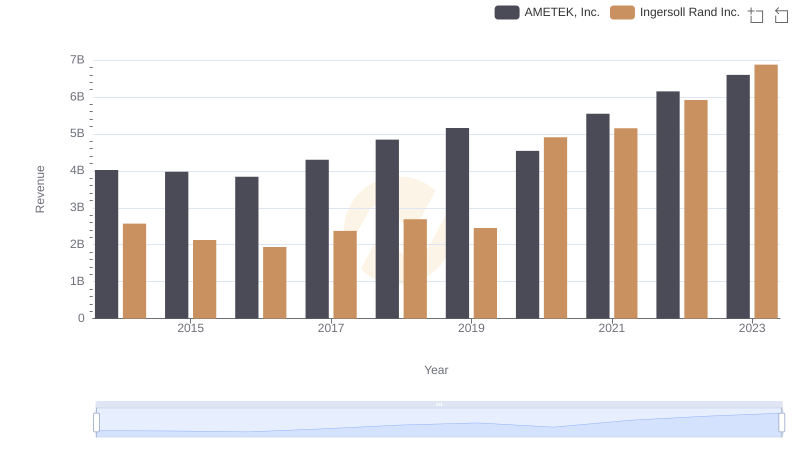
Breaking Down Revenue Trends: AMETEK, Inc. vs Ingersoll Rand Inc.
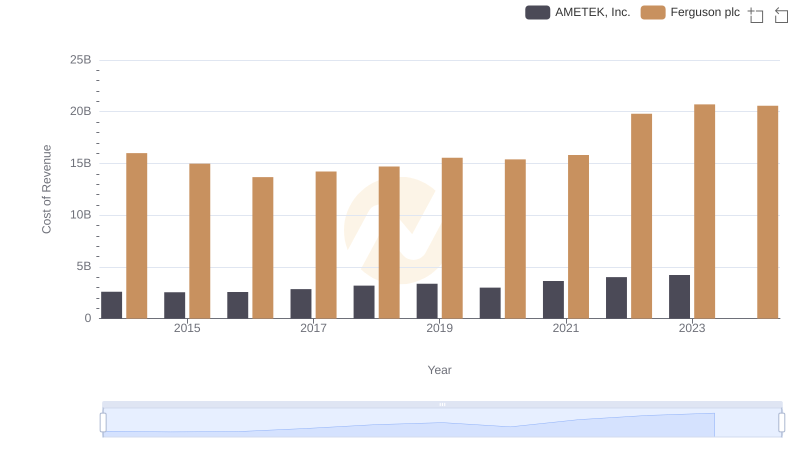
AMETEK, Inc. vs Ferguson plc: Efficiency in Cost of Revenue Explored
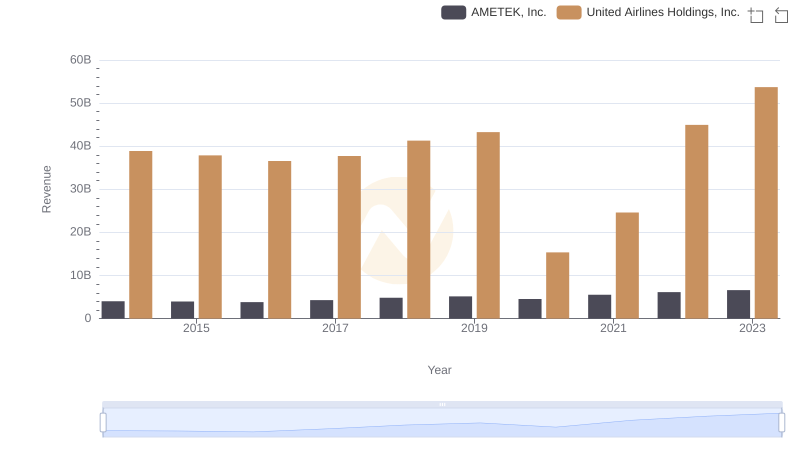
Breaking Down Revenue Trends: AMETEK, Inc. vs United Airlines Holdings, Inc.
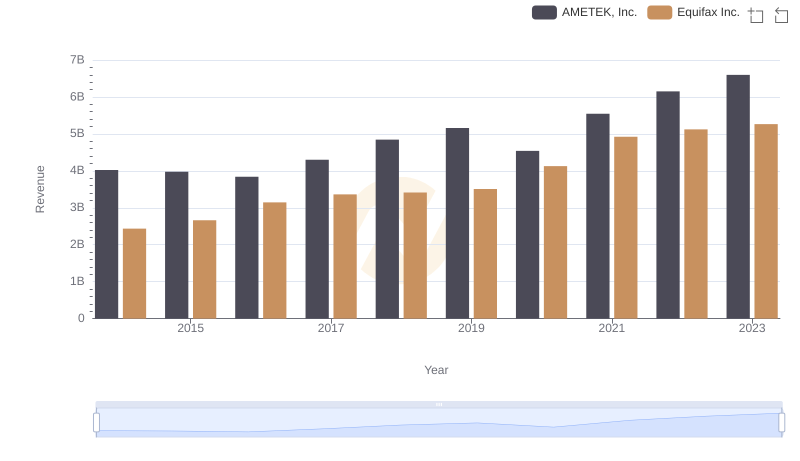
AMETEK, Inc. or Equifax Inc.: Who Leads in Yearly Revenue?
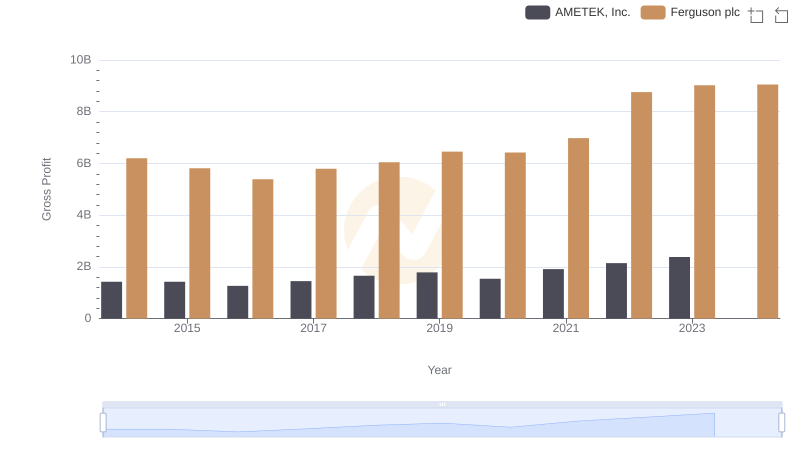
Key Insights on Gross Profit: AMETEK, Inc. vs Ferguson plc
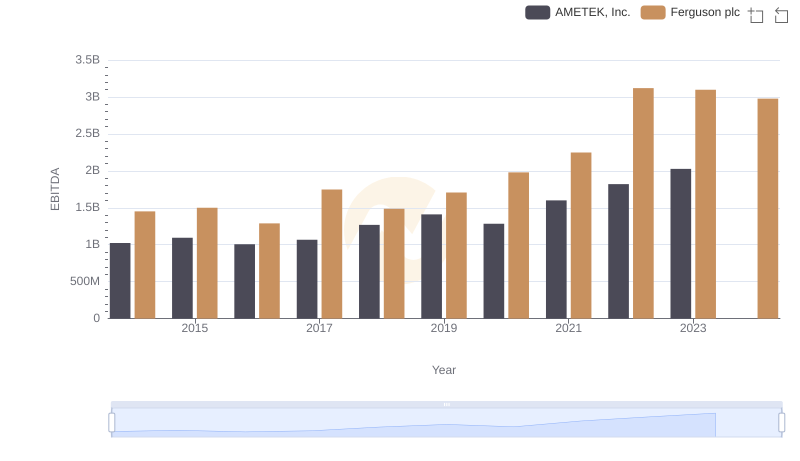
A Side-by-Side Analysis of EBITDA: AMETEK, Inc. and Ferguson plc