| __timestamp | AMETEK, Inc. | Xylem Inc. |
|---|---|---|
| Wednesday, January 1, 2014 | 1424947000 | 1513000000 |
| Thursday, January 1, 2015 | 1425015000 | 1404000000 |
| Friday, January 1, 2016 | 1264867000 | 1461000000 |
| Sunday, January 1, 2017 | 1448739000 | 1851000000 |
| Monday, January 1, 2018 | 1659562000 | 2026000000 |
| Tuesday, January 1, 2019 | 1787660000 | 2046000000 |
| Wednesday, January 1, 2020 | 1543514000 | 1830000000 |
| Friday, January 1, 2021 | 1912614000 | 1975000000 |
| Saturday, January 1, 2022 | 2145269000 | 2084000000 |
| Sunday, January 1, 2023 | 2384465001 | 2717000000 |
| Monday, January 1, 2024 | 6941180000 |
Unleashing the power of data
In the competitive landscape of industrial technology, AMETEK, Inc. and Xylem Inc. have emerged as formidable players. Over the past decade, these companies have demonstrated remarkable growth in gross profit, reflecting their strategic prowess and market adaptability.
From 2014 to 2023, AMETEK, Inc. saw its gross profit soar by approximately 67%, while Xylem Inc. experienced a 79% increase. This impressive growth trajectory underscores the companies' ability to innovate and capture market share. Notably, in 2023, Xylem Inc. outpaced AMETEK, Inc. with a gross profit that was about 14% higher, marking a significant milestone in its financial journey.
The data reveals a consistent upward trend for both companies, with Xylem Inc. taking the lead in recent years. This performance can be attributed to their strategic investments in technology and sustainable solutions, positioning them as leaders in the industrial sector.
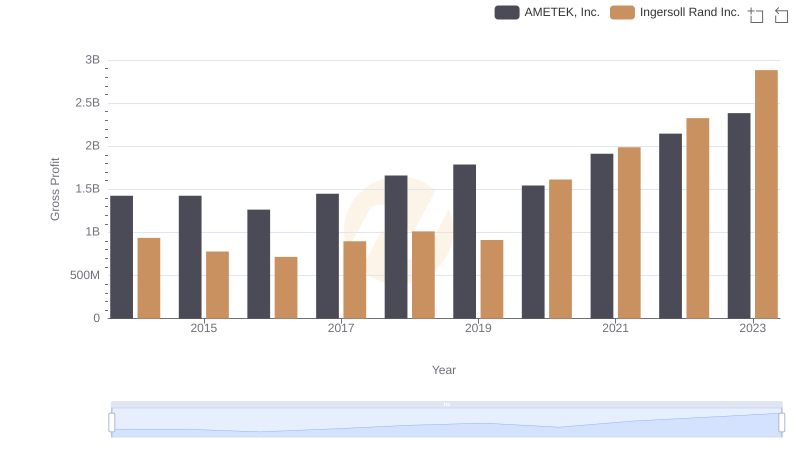
Gross Profit Comparison: AMETEK, Inc. and Ingersoll Rand Inc. Trends
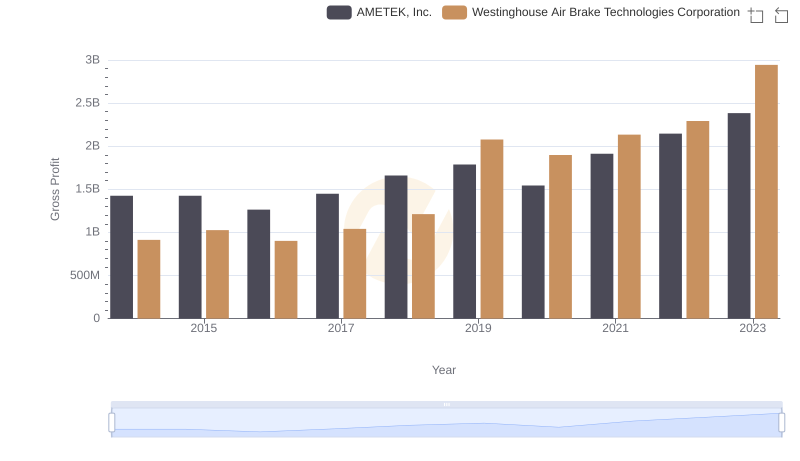
Gross Profit Trends Compared: AMETEK, Inc. vs Westinghouse Air Brake Technologies Corporation
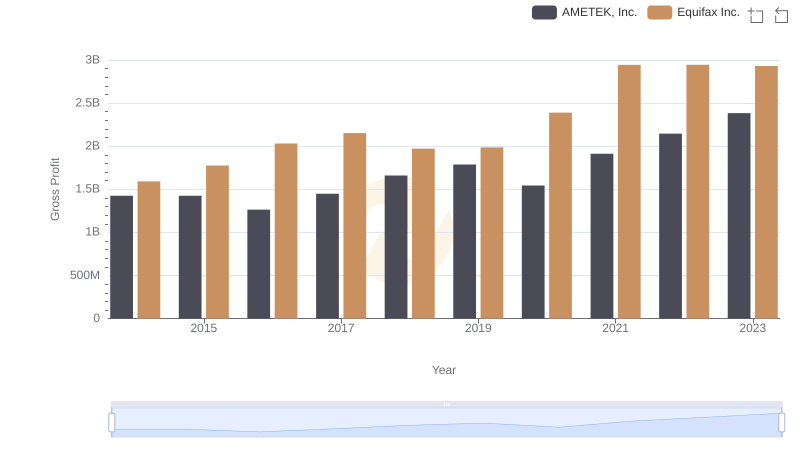
Gross Profit Trends Compared: AMETEK, Inc. vs Equifax Inc.

Key Insights on Gross Profit: AMETEK, Inc. vs Ferrovial SE
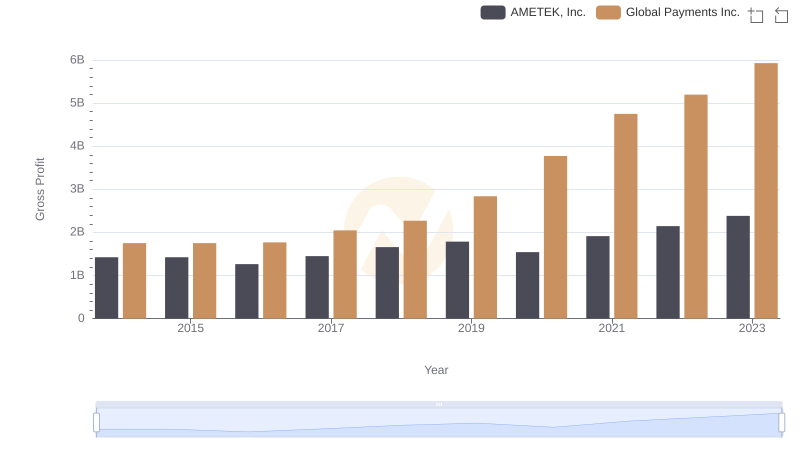
AMETEK, Inc. vs Global Payments Inc.: A Gross Profit Performance Breakdown
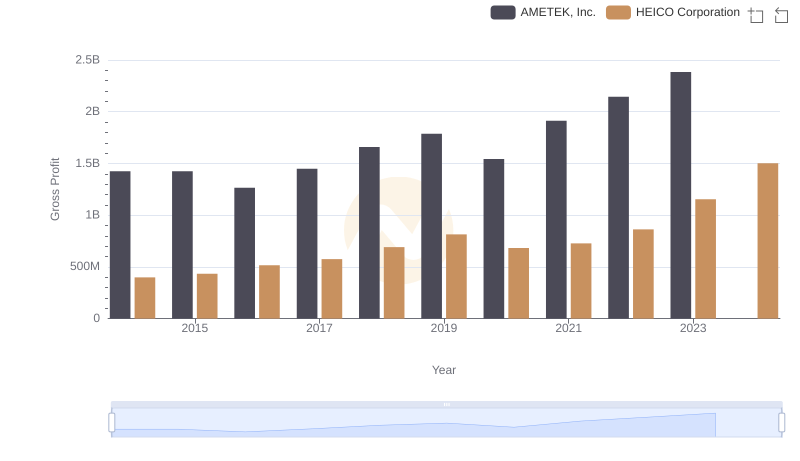
Gross Profit Trends Compared: AMETEK, Inc. vs HEICO Corporation
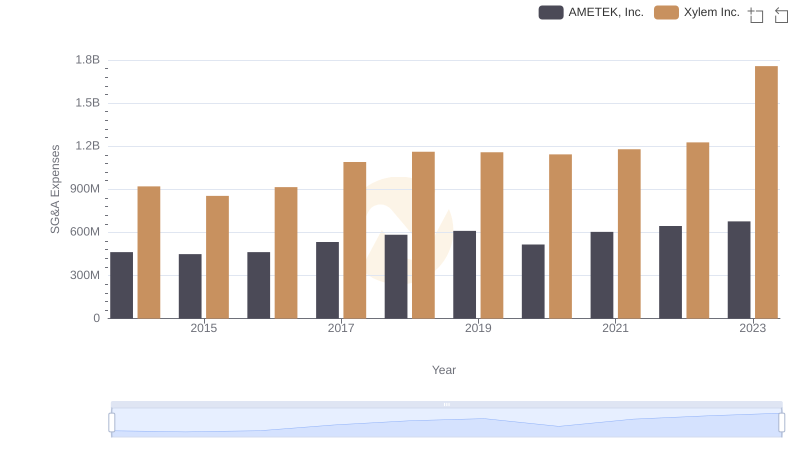
Comparing SG&A Expenses: AMETEK, Inc. vs Xylem Inc. Trends and Insights
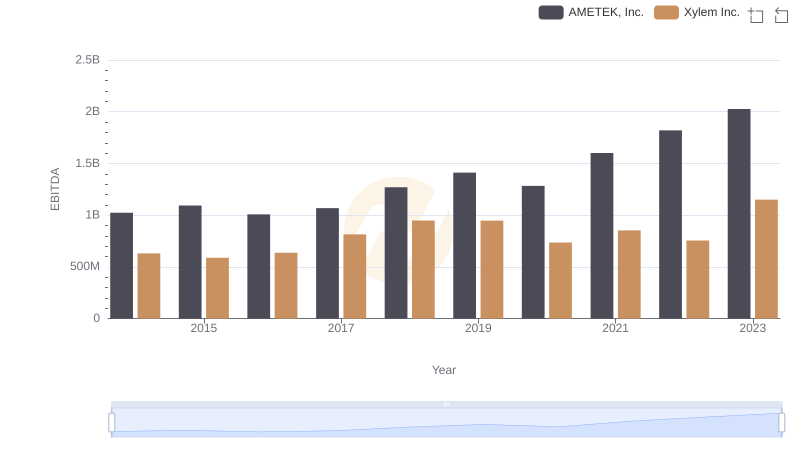
Professional EBITDA Benchmarking: AMETEK, Inc. vs Xylem Inc.