| __timestamp | Guidewire Software, Inc. | Intuit Inc. |
|---|---|---|
| Wednesday, January 1, 2014 | 148947000 | 668000000 |
| Thursday, January 1, 2015 | 147184000 | 725000000 |
| Friday, January 1, 2016 | 151834000 | 752000000 |
| Sunday, January 1, 2017 | 191559000 | 809000000 |
| Monday, January 1, 2018 | 296707000 | 977000000 |
| Tuesday, January 1, 2019 | 324350000 | 1167000000 |
| Wednesday, January 1, 2020 | 338015000 | 1378000000 |
| Friday, January 1, 2021 | 375054000 | 1683000000 |
| Saturday, January 1, 2022 | 460394000 | 2406000000 |
| Sunday, January 1, 2023 | 447130000 | 3143000000 |
| Monday, January 1, 2024 | 397136000 | 3465000000 |
Data in motion
In the ever-evolving tech landscape, understanding cost structures is pivotal. Over the past decade, Intuit Inc. and Guidewire Software, Inc. have showcased intriguing trends in their cost of revenue. From 2014 to 2024, Intuit's cost of revenue surged by over 400%, peaking in 2024. This reflects its aggressive growth strategy and expanding product offerings. In contrast, Guidewire's costs increased by approximately 167%, indicating a more measured expansion.
These trends underscore the strategic differences between the two companies, offering valuable insights for investors and industry analysts alike.
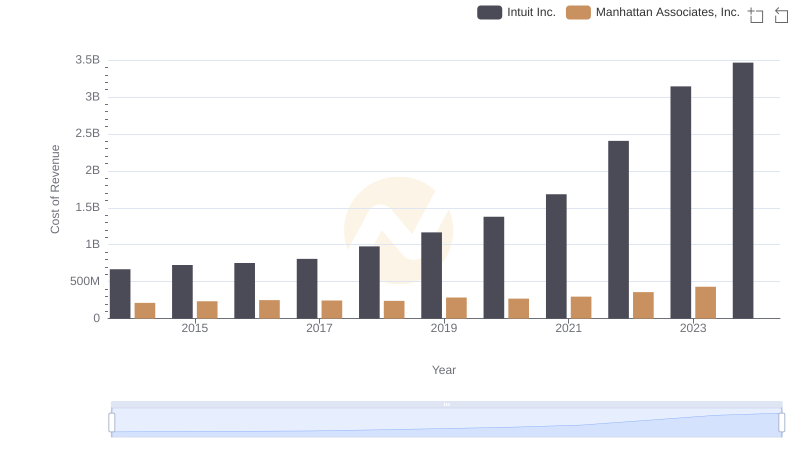
Analyzing Cost of Revenue: Intuit Inc. and Manhattan Associates, Inc.
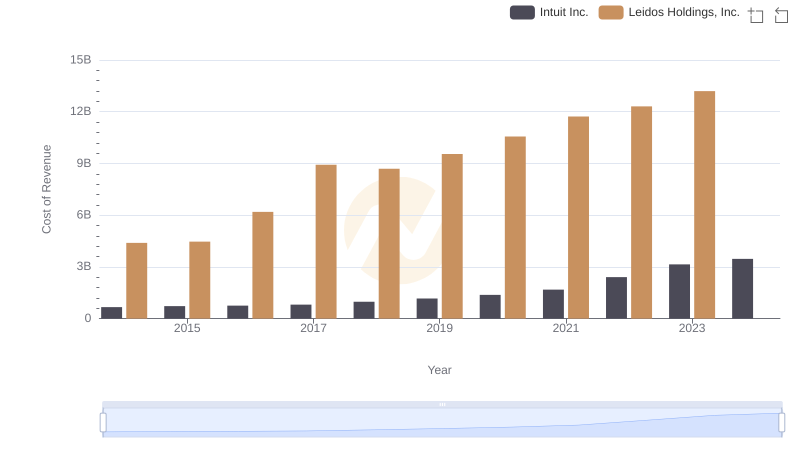
Intuit Inc. vs Leidos Holdings, Inc.: Efficiency in Cost of Revenue Explored
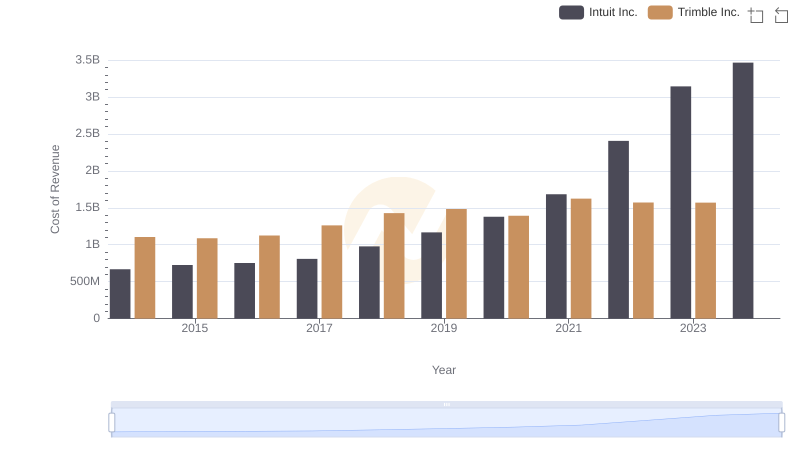
Comparing Cost of Revenue Efficiency: Intuit Inc. vs Trimble Inc.
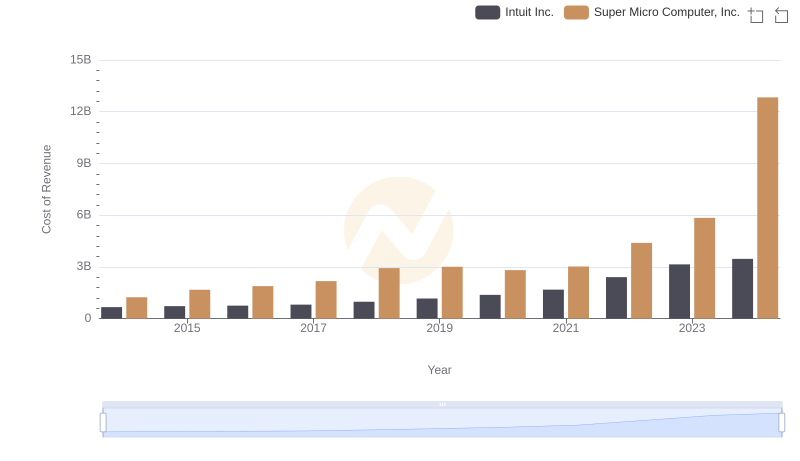
Cost of Revenue: Key Insights for Intuit Inc. and Super Micro Computer, Inc.
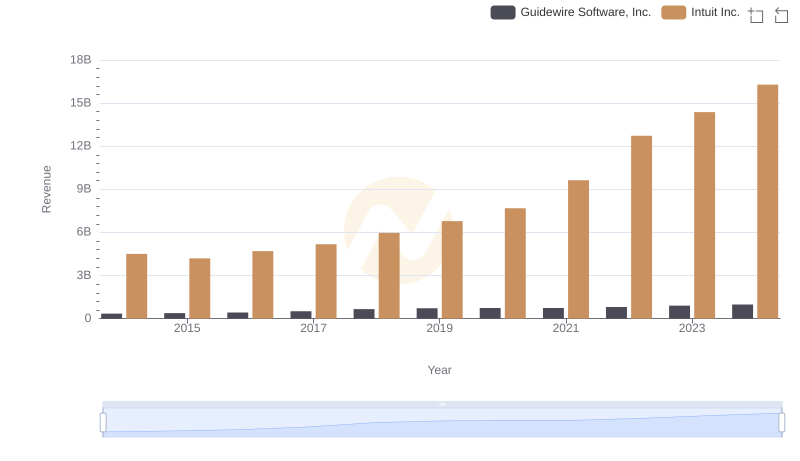
Intuit Inc. vs Guidewire Software, Inc.: Annual Revenue Growth Compared
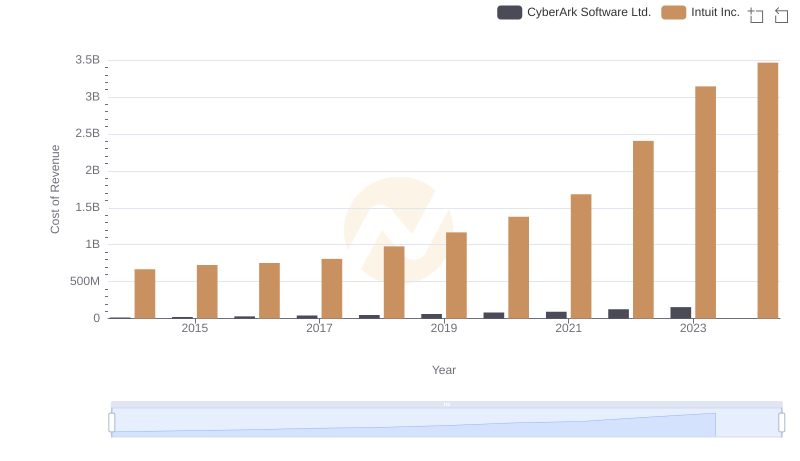
Cost of Revenue Trends: Intuit Inc. vs CyberArk Software Ltd.
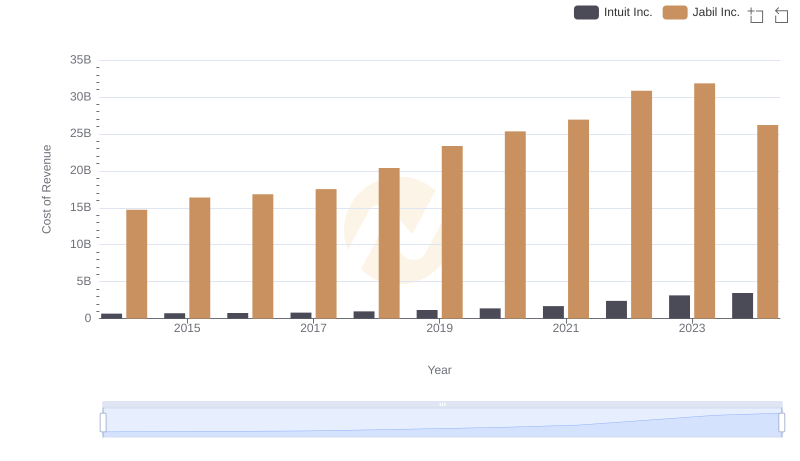
Cost Insights: Breaking Down Intuit Inc. and Jabil Inc.'s Expenses
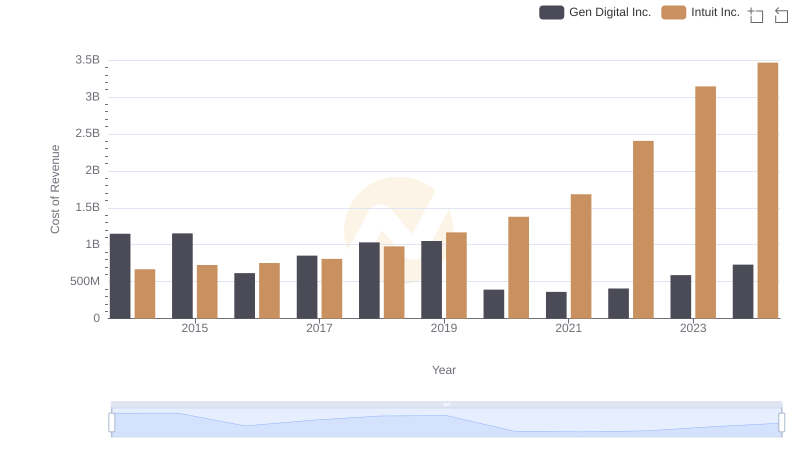
Comparing Cost of Revenue Efficiency: Intuit Inc. vs Gen Digital Inc.
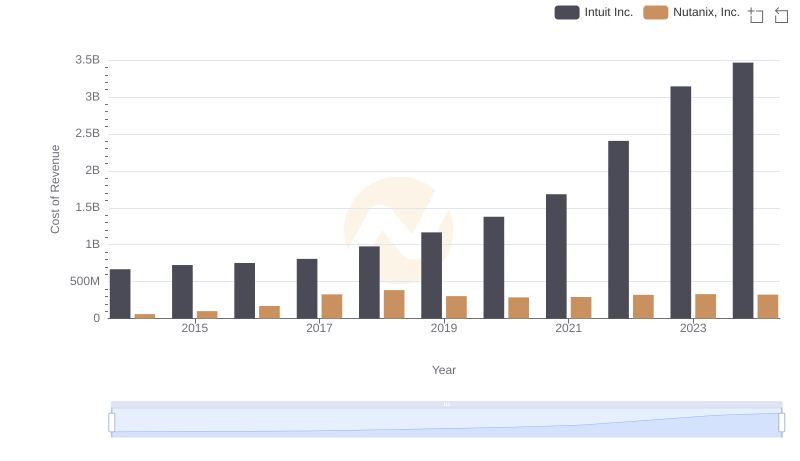
Intuit Inc. vs Nutanix, Inc.: Efficiency in Cost of Revenue Explored
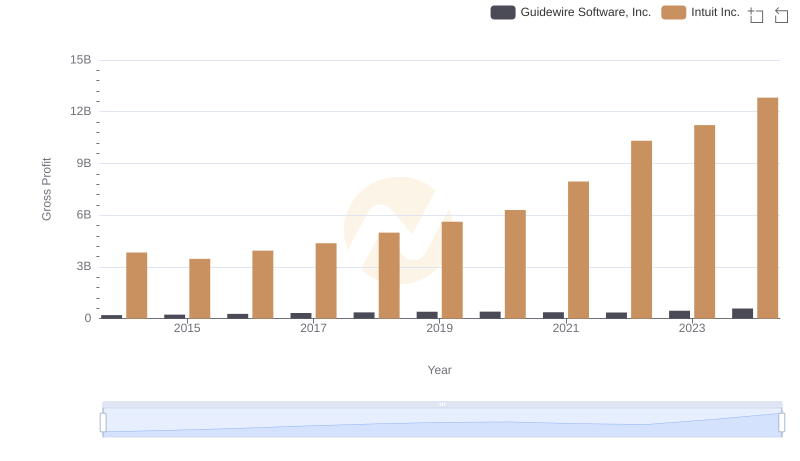
Gross Profit Analysis: Comparing Intuit Inc. and Guidewire Software, Inc.
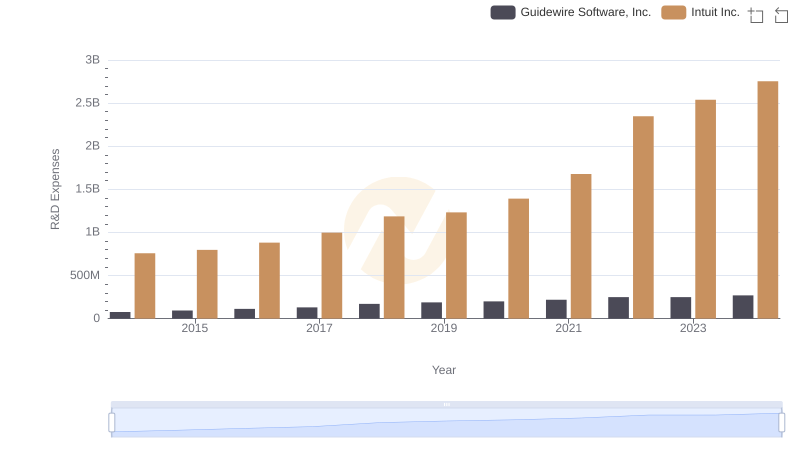
Research and Development Expenses Breakdown: Intuit Inc. vs Guidewire Software, Inc.
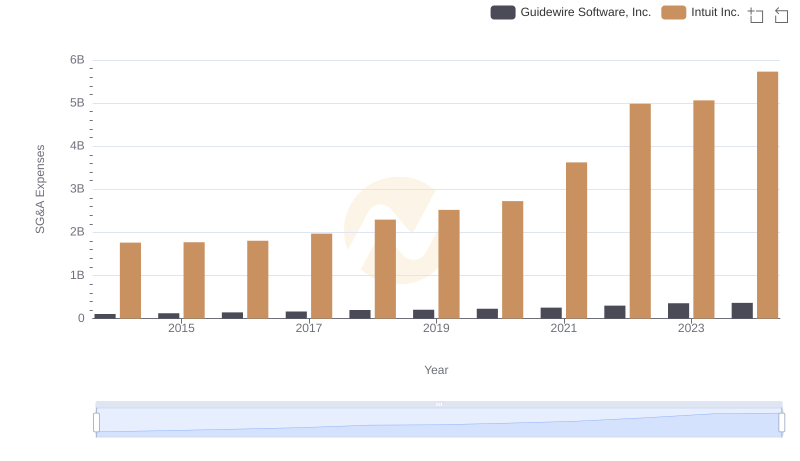
Selling, General, and Administrative Costs: Intuit Inc. vs Guidewire Software, Inc.