| __timestamp | International Business Machines Corporation | PTC Inc. |
|---|---|---|
| Wednesday, January 1, 2014 | 22472000000 | 499679000 |
| Thursday, January 1, 2015 | 19894000000 | 557301000 |
| Friday, January 1, 2016 | 20279000000 | 513080000 |
| Sunday, January 1, 2017 | 19680000000 | 518013000 |
| Monday, January 1, 2018 | 19366000000 | 557505000 |
| Tuesday, January 1, 2019 | 18724000000 | 545368000 |
| Wednesday, January 1, 2020 | 20561000000 | 595277000 |
| Friday, January 1, 2021 | 18745000000 | 723785000 |
| Saturday, January 1, 2022 | 17483000000 | 689979000 |
| Sunday, January 1, 2023 | 17997000000 | 763641000 |
| Monday, January 1, 2024 | 29536000000 | 791331000 |
Unveiling the hidden dimensions of data
In the ever-evolving landscape of technology, understanding the financial strategies of industry giants like International Business Machines Corporation (IBM) and PTC Inc. is crucial. Over the past decade, IBM's Selling, General, and Administrative (SG&A) expenses have shown a fluctuating trend, peaking in 2024 with a 30% increase from 2023. This suggests a strategic shift or investment in operations. In contrast, PTC Inc. has maintained a more consistent growth in SG&A expenses, with a notable 52% rise from 2014 to 2024. This steady increase reflects PTC's expanding market presence and operational scaling. The data highlights IBM's larger financial footprint, with SG&A expenses consistently over 20 times that of PTC. As we move forward, these trends offer insights into each company's strategic priorities and market positioning.

International Business Machines Corporation and PTC Inc.: A Comprehensive Revenue Analysis
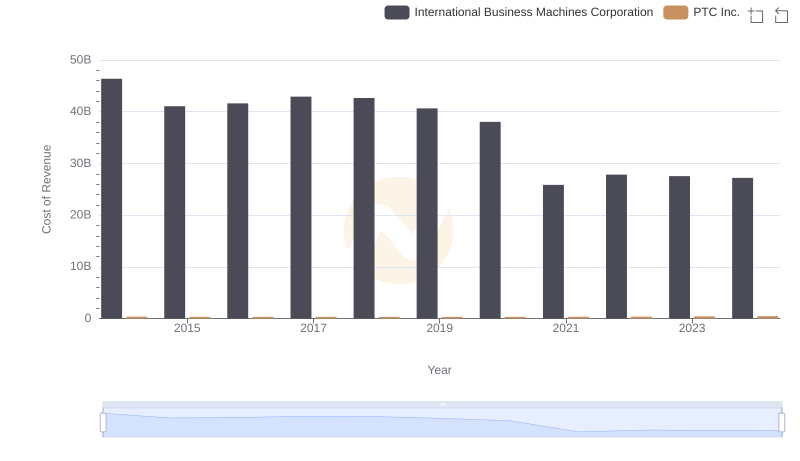
Cost Insights: Breaking Down International Business Machines Corporation and PTC Inc.'s Expenses
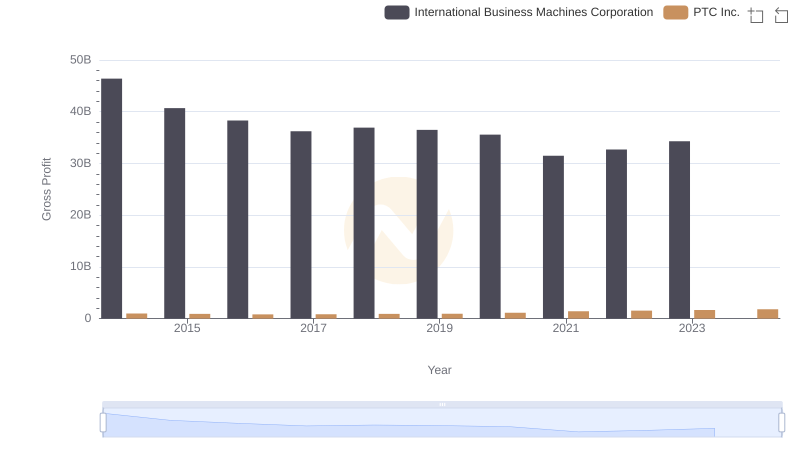
Gross Profit Analysis: Comparing International Business Machines Corporation and PTC Inc.
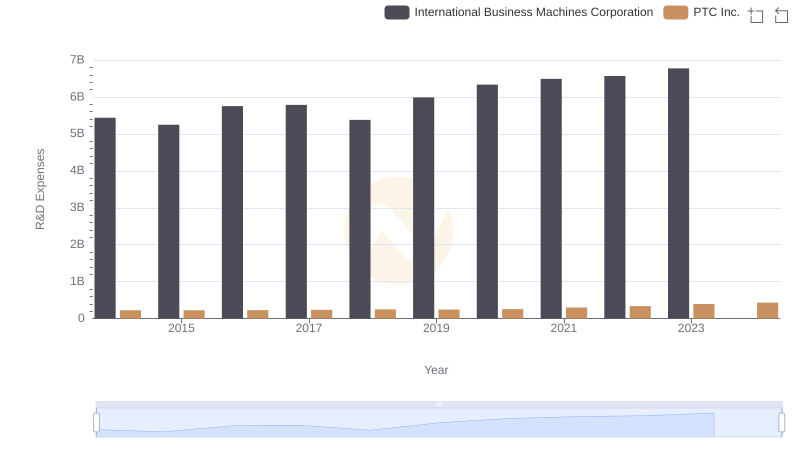
International Business Machines Corporation or PTC Inc.: Who Invests More in Innovation?
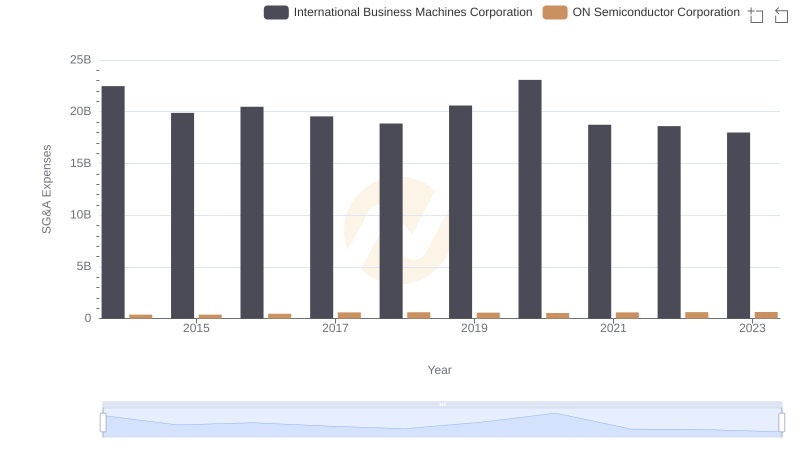
Breaking Down SG&A Expenses: International Business Machines Corporation vs ON Semiconductor Corporation
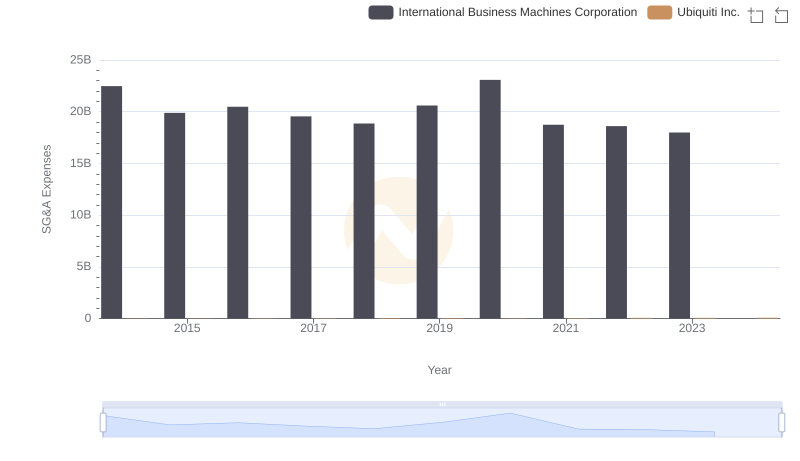
Breaking Down SG&A Expenses: International Business Machines Corporation vs Ubiquiti Inc.
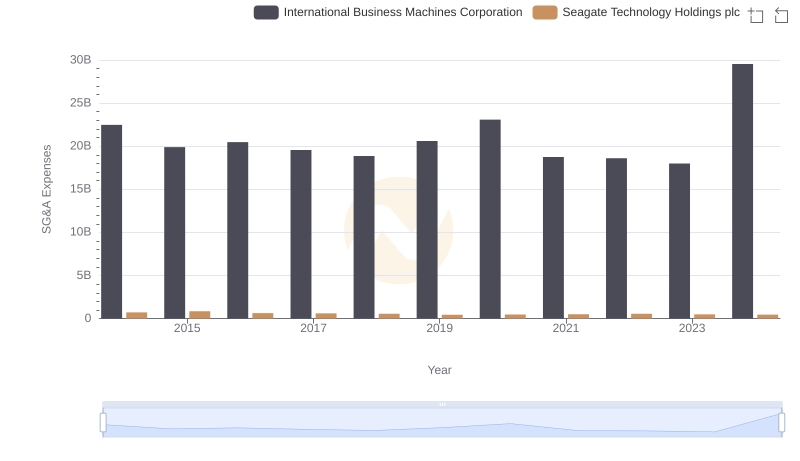
Cost Management Insights: SG&A Expenses for International Business Machines Corporation and Seagate Technology Holdings plc
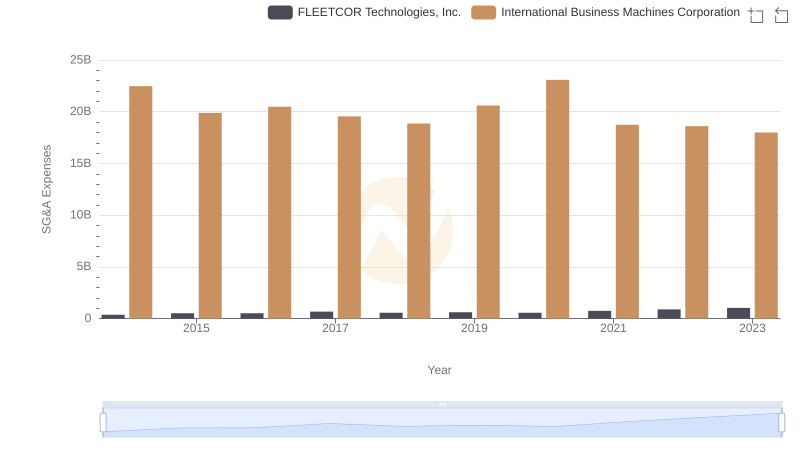
International Business Machines Corporation vs FLEETCOR Technologies, Inc.: SG&A Expense Trends
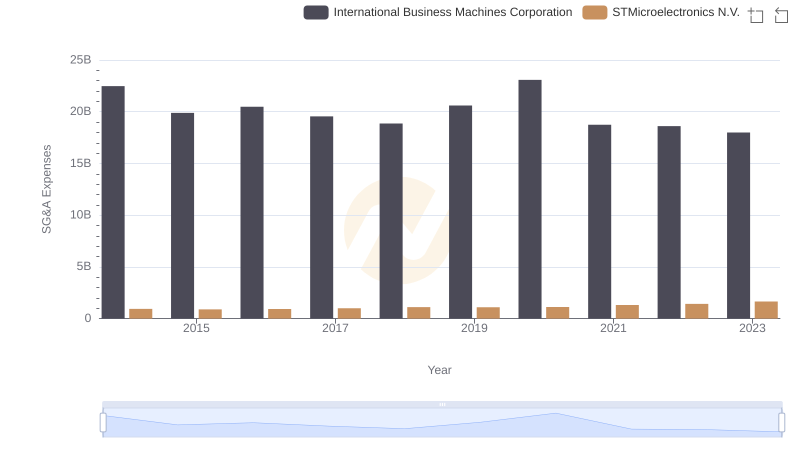
International Business Machines Corporation or STMicroelectronics N.V.: Who Manages SG&A Costs Better?
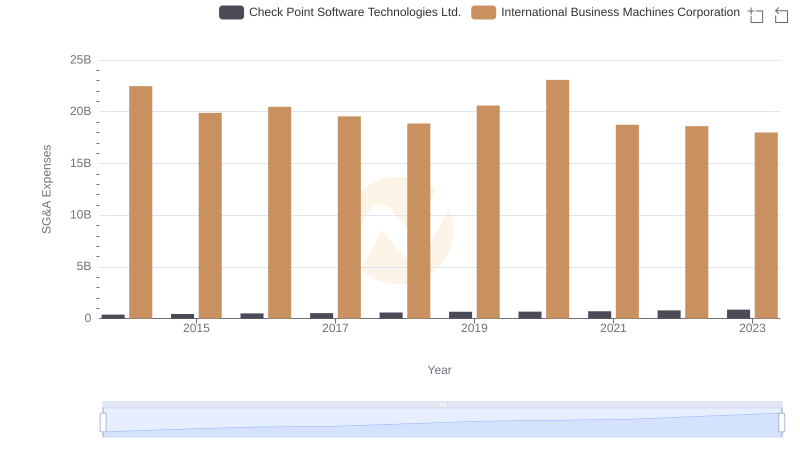
Operational Costs Compared: SG&A Analysis of International Business Machines Corporation and Check Point Software Technologies Ltd.
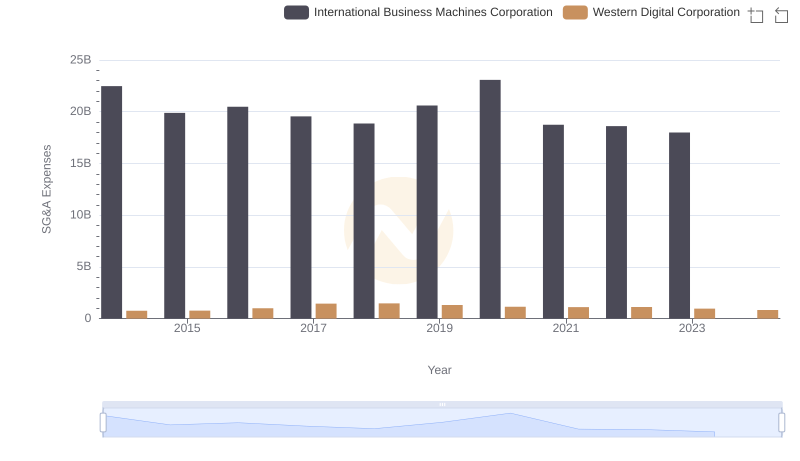
Selling, General, and Administrative Costs: International Business Machines Corporation vs Western Digital Corporation

EBITDA Analysis: Evaluating International Business Machines Corporation Against PTC Inc.