| __timestamp | FLEETCOR Technologies, Inc. | International Business Machines Corporation |
|---|---|---|
| Wednesday, January 1, 2014 | 377744000 | 22472000000 |
| Thursday, January 1, 2015 | 515047000 | 19894000000 |
| Friday, January 1, 2016 | 519413000 | 20279000000 |
| Sunday, January 1, 2017 | 671544000 | 19680000000 |
| Monday, January 1, 2018 | 571765000 | 19366000000 |
| Tuesday, January 1, 2019 | 612016000 | 18724000000 |
| Wednesday, January 1, 2020 | 567410000 | 20561000000 |
| Friday, January 1, 2021 | 747948000 | 18745000000 |
| Saturday, January 1, 2022 | 893217000 | 17483000000 |
| Sunday, January 1, 2023 | 1034248000 | 17997000000 |
| Monday, January 1, 2024 | 997780000 | 29536000000 |
Infusing magic into the data realm
In the ever-evolving landscape of corporate finance, understanding the trends in Selling, General, and Administrative (SG&A) expenses is crucial for investors and analysts alike. This article delves into the SG&A expense patterns of two industry giants: International Business Machines Corporation (IBM) and FLEETCOR Technologies, Inc., from 2014 to 2023.
IBM, a stalwart in the tech industry, has consistently maintained high SG&A expenses, peaking at approximately $22 billion in 2014. Over the years, IBM's expenses have shown a gradual decline, reaching around $18 billion by 2023, reflecting a strategic shift towards efficiency.
Conversely, FLEETCOR Technologies, a leader in business payments, has seen its SG&A expenses grow significantly, from $378 million in 2014 to over $1 billion in 2023. This 173% increase underscores FLEETCOR's aggressive expansion and investment in operational capabilities.
The data for 2024 is incomplete, highlighting the dynamic nature of financial forecasting.
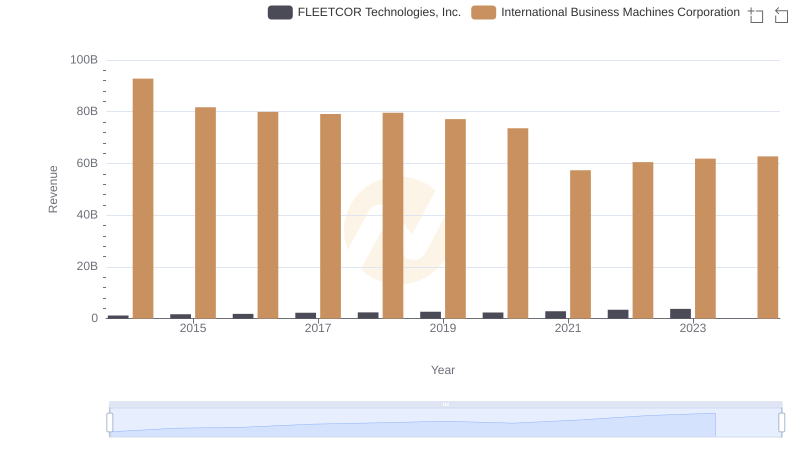
International Business Machines Corporation vs FLEETCOR Technologies, Inc.: Examining Key Revenue Metrics
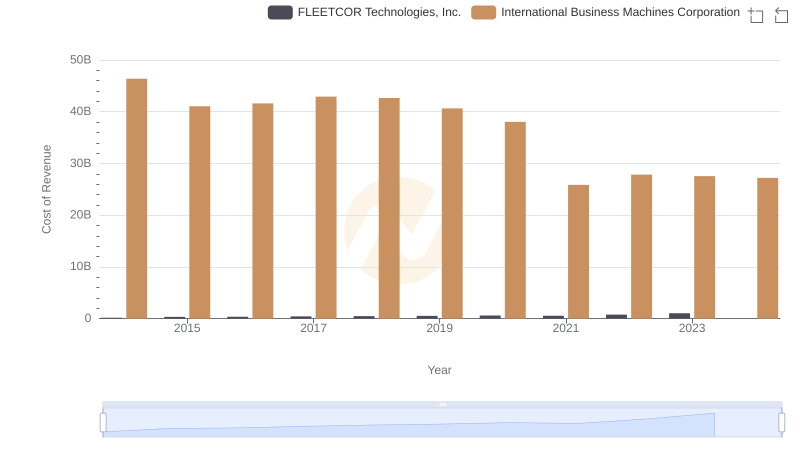
Analyzing Cost of Revenue: International Business Machines Corporation and FLEETCOR Technologies, Inc.
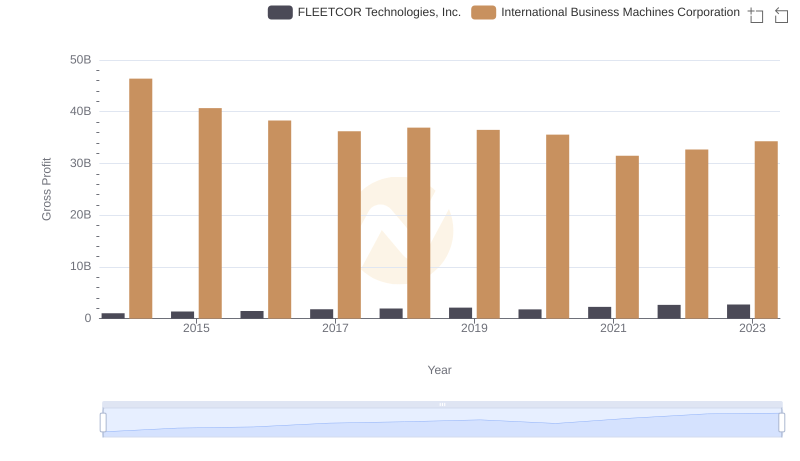
Gross Profit Comparison: International Business Machines Corporation and FLEETCOR Technologies, Inc. Trends

SG&A Efficiency Analysis: Comparing International Business Machines Corporation and Teledyne Technologies Incorporated
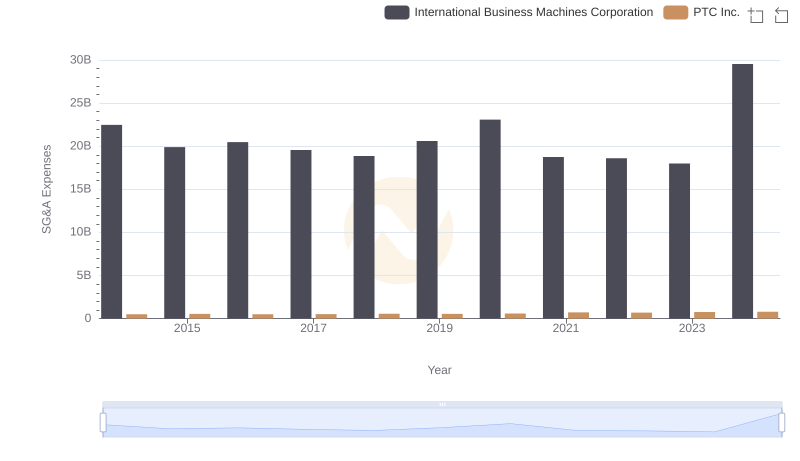
International Business Machines Corporation vs PTC Inc.: SG&A Expense Trends
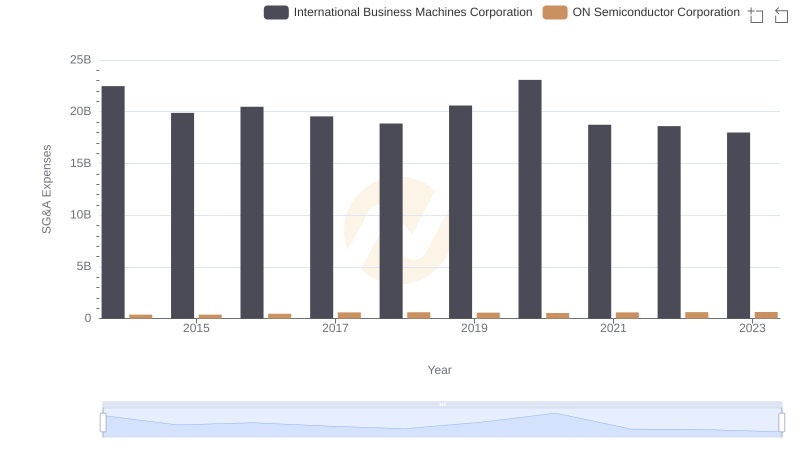
Breaking Down SG&A Expenses: International Business Machines Corporation vs ON Semiconductor Corporation
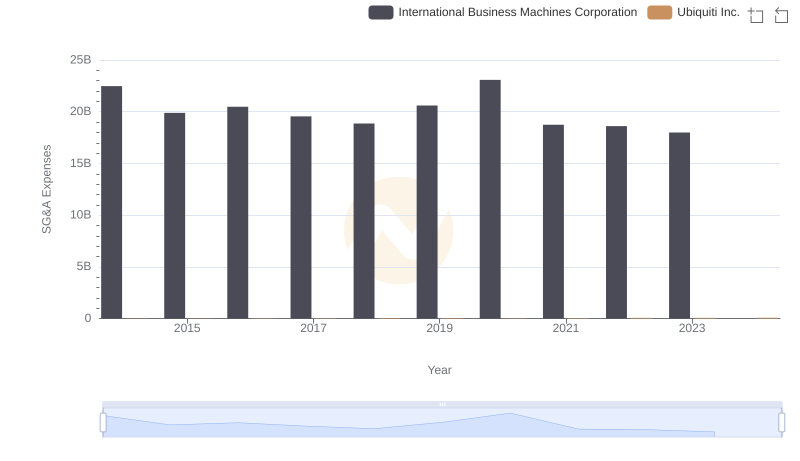
Breaking Down SG&A Expenses: International Business Machines Corporation vs Ubiquiti Inc.
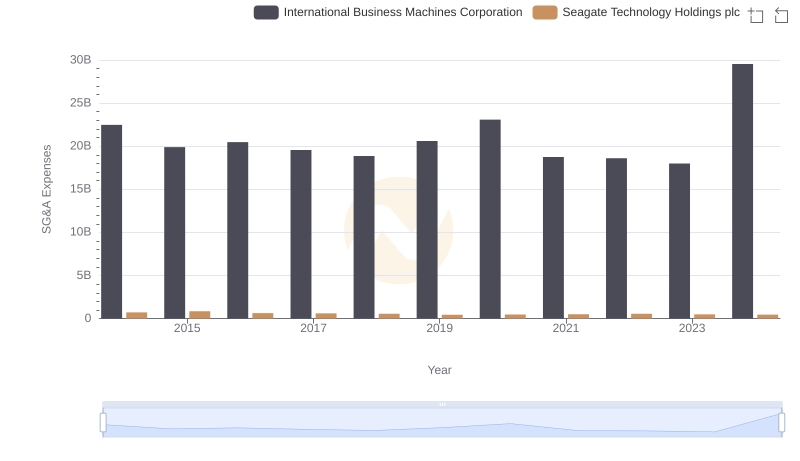
Cost Management Insights: SG&A Expenses for International Business Machines Corporation and Seagate Technology Holdings plc
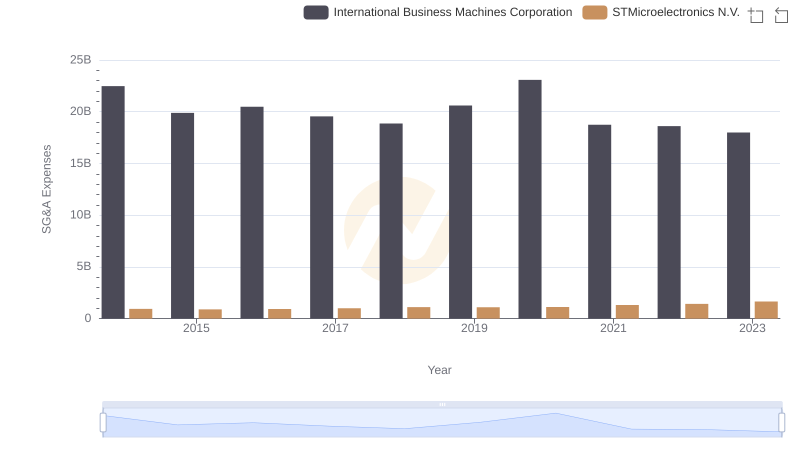
International Business Machines Corporation or STMicroelectronics N.V.: Who Manages SG&A Costs Better?
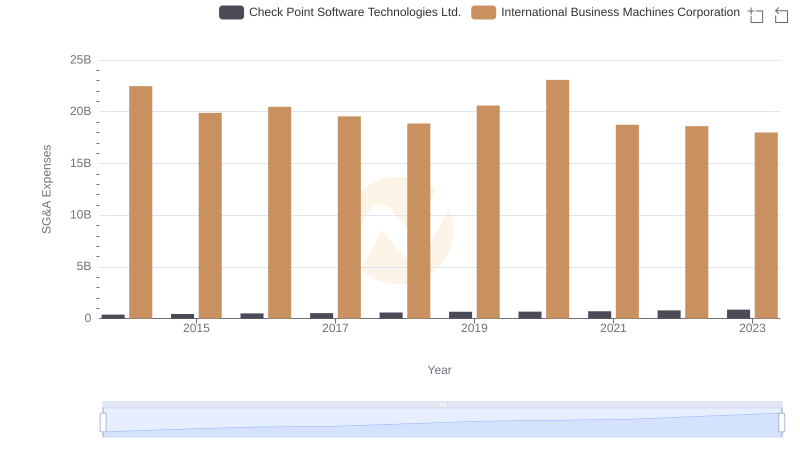
Operational Costs Compared: SG&A Analysis of International Business Machines Corporation and Check Point Software Technologies Ltd.
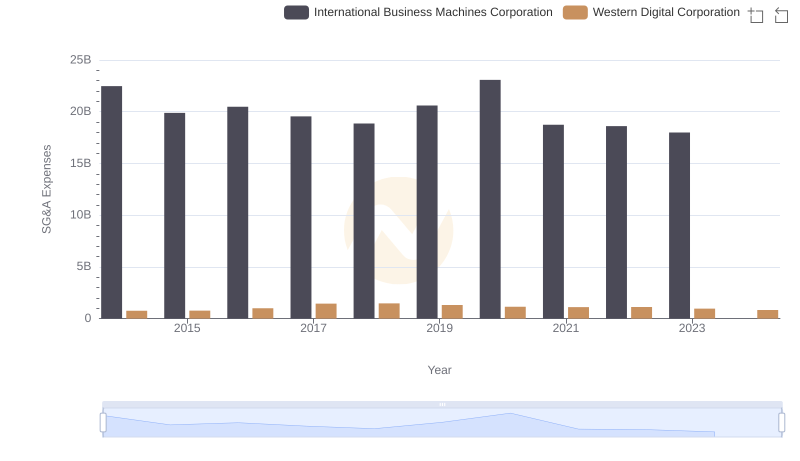
Selling, General, and Administrative Costs: International Business Machines Corporation vs Western Digital Corporation

International Business Machines Corporation vs FLEETCOR Technologies, Inc.: In-Depth EBITDA Performance Comparison