| __timestamp | Check Point Software Technologies Ltd. | International Business Machines Corporation |
|---|---|---|
| Wednesday, January 1, 2014 | 384921000 | 22472000000 |
| Thursday, January 1, 2015 | 451785000 | 19894000000 |
| Friday, January 1, 2016 | 508656000 | 20279000000 |
| Sunday, January 1, 2017 | 525392000 | 19680000000 |
| Monday, January 1, 2018 | 589799000 | 19366000000 |
| Tuesday, January 1, 2019 | 658400000 | 18724000000 |
| Wednesday, January 1, 2020 | 681400000 | 20561000000 |
| Friday, January 1, 2021 | 708500000 | 18745000000 |
| Saturday, January 1, 2022 | 791300000 | 17483000000 |
| Sunday, January 1, 2023 | 864100000 | 17997000000 |
| Monday, January 1, 2024 | 29536000000 |
Unveiling the hidden dimensions of data
In the ever-evolving landscape of technology, operational efficiency is paramount. This analysis delves into the Selling, General, and Administrative (SG&A) expenses of two tech giants: International Business Machines Corporation (IBM) and Check Point Software Technologies Ltd. Over the past decade, IBM's SG&A expenses have consistently dwarfed those of Check Point, averaging around 20 times higher. Notably, IBM's expenses peaked in 2014, with a gradual decline to 2023, reflecting a strategic shift towards cost optimization. In contrast, Check Point's expenses have shown a steady upward trend, increasing by approximately 124% from 2014 to 2023. This divergence highlights IBM's focus on streamlining operations, while Check Point invests in growth. The data for 2024 is incomplete, indicating potential shifts in strategy. This analysis underscores the importance of balancing operational costs with strategic growth in the tech industry.
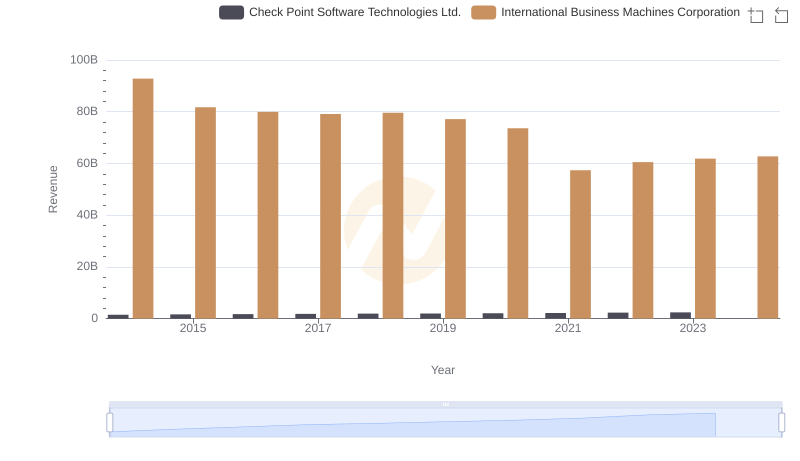
Annual Revenue Comparison: International Business Machines Corporation vs Check Point Software Technologies Ltd.
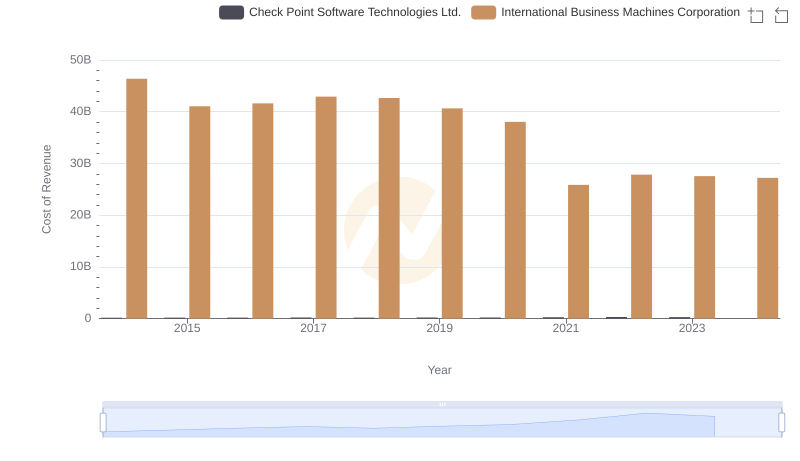
Cost of Revenue: Key Insights for International Business Machines Corporation and Check Point Software Technologies Ltd.
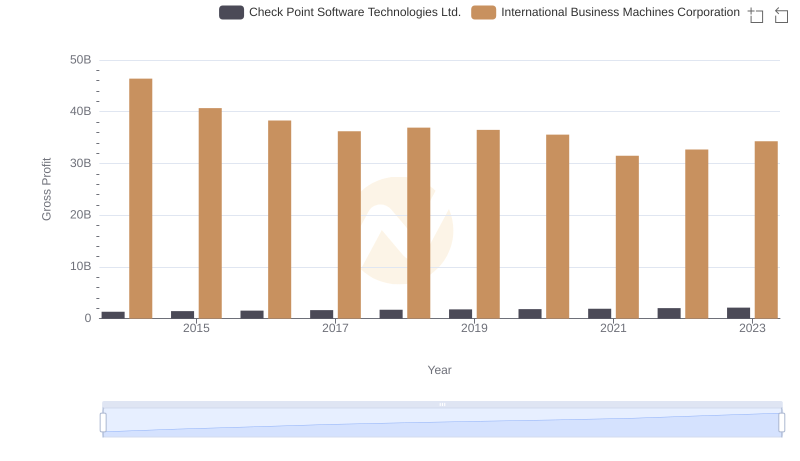
Key Insights on Gross Profit: International Business Machines Corporation vs Check Point Software Technologies Ltd.
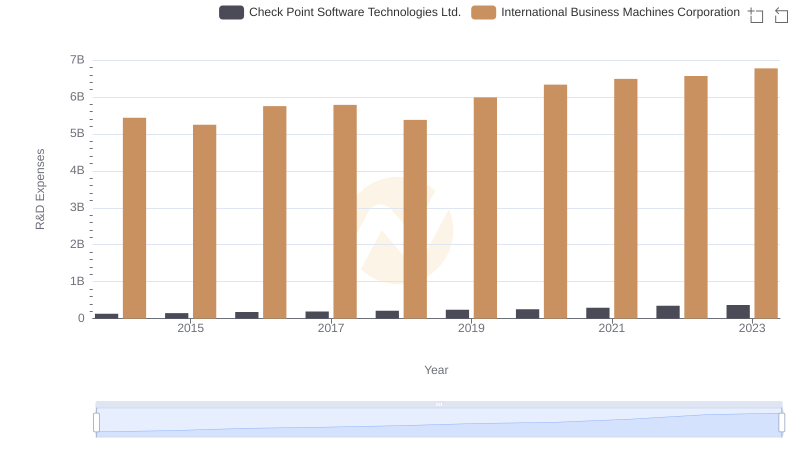
Research and Development Investment: International Business Machines Corporation vs Check Point Software Technologies Ltd.
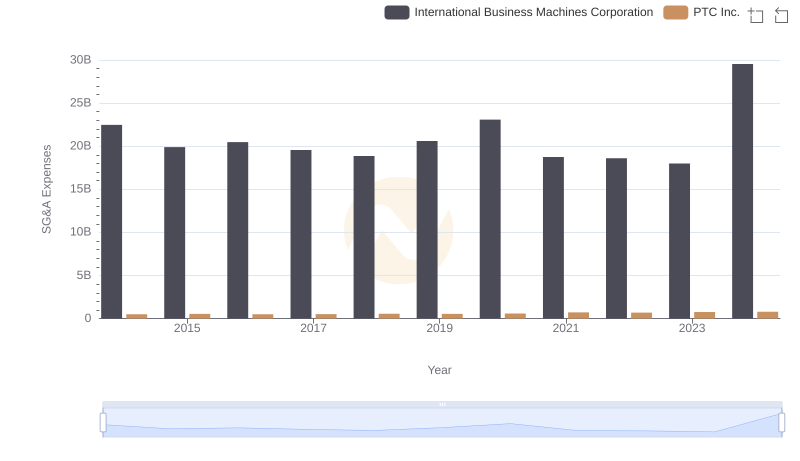
International Business Machines Corporation vs PTC Inc.: SG&A Expense Trends
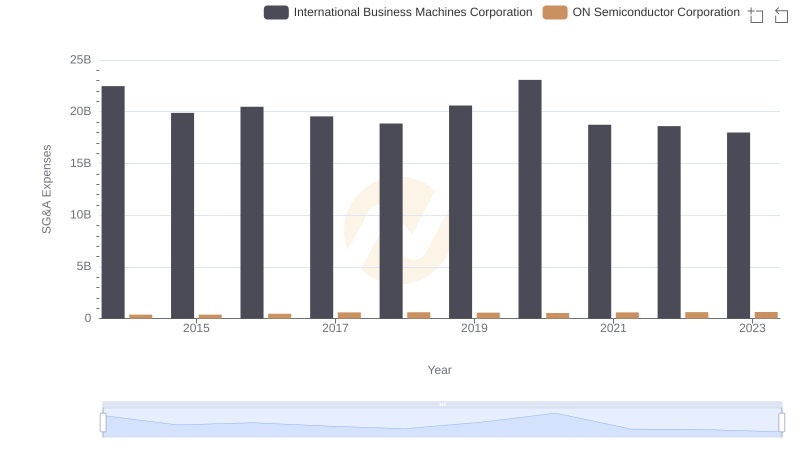
Breaking Down SG&A Expenses: International Business Machines Corporation vs ON Semiconductor Corporation
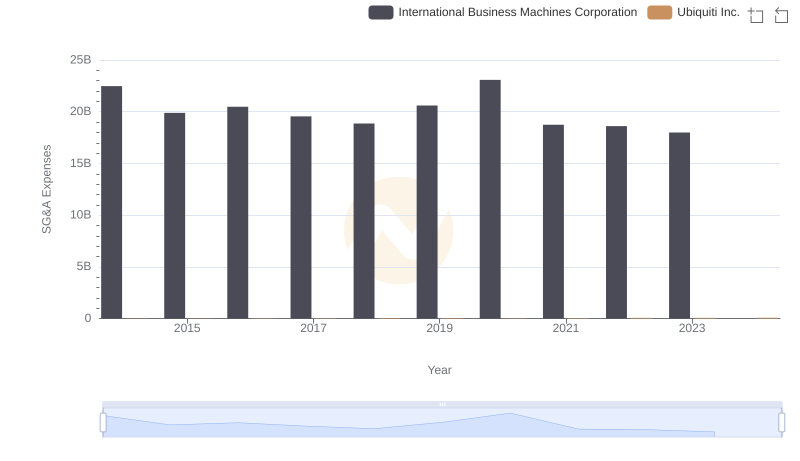
Breaking Down SG&A Expenses: International Business Machines Corporation vs Ubiquiti Inc.
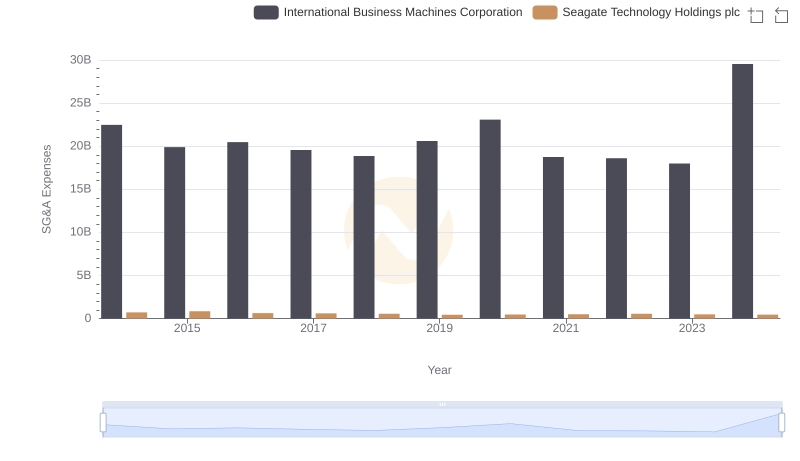
Cost Management Insights: SG&A Expenses for International Business Machines Corporation and Seagate Technology Holdings plc
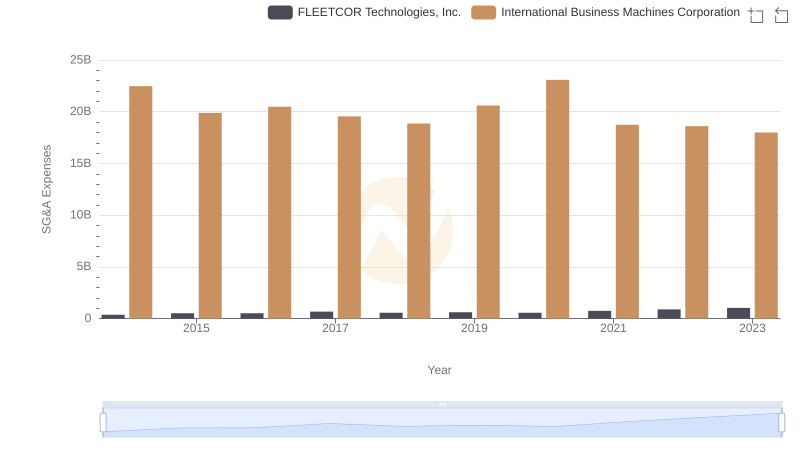
International Business Machines Corporation vs FLEETCOR Technologies, Inc.: SG&A Expense Trends
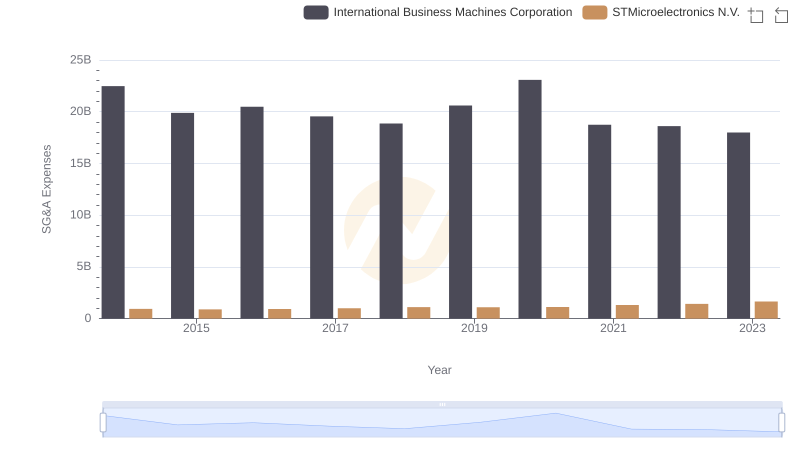
International Business Machines Corporation or STMicroelectronics N.V.: Who Manages SG&A Costs Better?
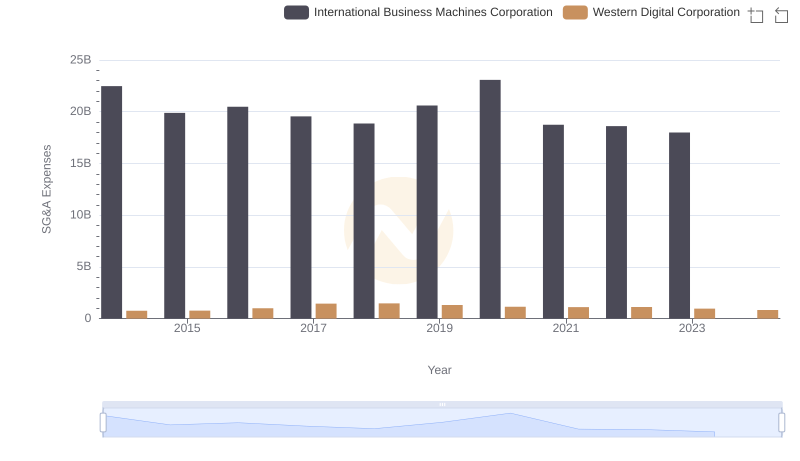
Selling, General, and Administrative Costs: International Business Machines Corporation vs Western Digital Corporation
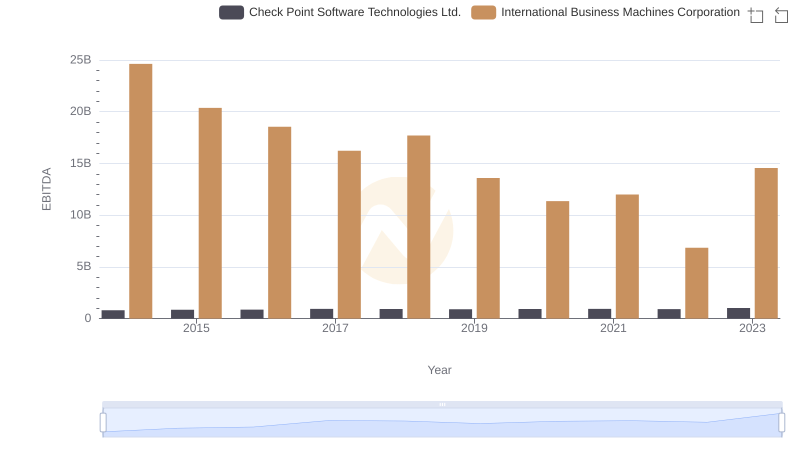
International Business Machines Corporation and Check Point Software Technologies Ltd.: A Detailed Examination of EBITDA Performance