| __timestamp | International Business Machines Corporation | PTC Inc. |
|---|---|---|
| Wednesday, January 1, 2014 | 46407000000 | 983284000 |
| Thursday, January 1, 2015 | 40684000000 | 920508000 |
| Friday, January 1, 2016 | 38516000000 | 814868000 |
| Sunday, January 1, 2017 | 36943000000 | 835020000 |
| Monday, January 1, 2018 | 36936000000 | 915630000 |
| Tuesday, January 1, 2019 | 31533000000 | 930253000 |
| Wednesday, January 1, 2020 | 30865000000 | 1124144000 |
| Friday, January 1, 2021 | 31486000000 | 1436057000 |
| Saturday, January 1, 2022 | 32687000000 | 1547367000 |
| Sunday, January 1, 2023 | 34300000000 | 1656047000 |
| Monday, January 1, 2024 | 35551000000 | 1811638000 |
Unleashing the power of data
In the ever-evolving landscape of technology, the financial performance of industry giants like International Business Machines Corporation (IBM) and PTC Inc. offers a fascinating glimpse into their strategic maneuvers. Over the past decade, IBM's gross profit has seen a notable decline, dropping from its peak in 2014 to a low in 2021, before showing signs of recovery in 2023. This represents a decrease of approximately 26% over the period. In contrast, PTC Inc. has demonstrated a steady upward trajectory, with its gross profit more than doubling from 2014 to 2023. This growth highlights PTC's successful adaptation to market demands and its strategic focus on innovation. While IBM's financial journey reflects the challenges of maintaining legacy systems amidst digital transformation, PTC's rise underscores the potential of agile, cloud-based solutions. As we look to the future, these trends offer valuable insights into the shifting dynamics of the tech industry.

International Business Machines Corporation and PTC Inc.: A Comprehensive Revenue Analysis
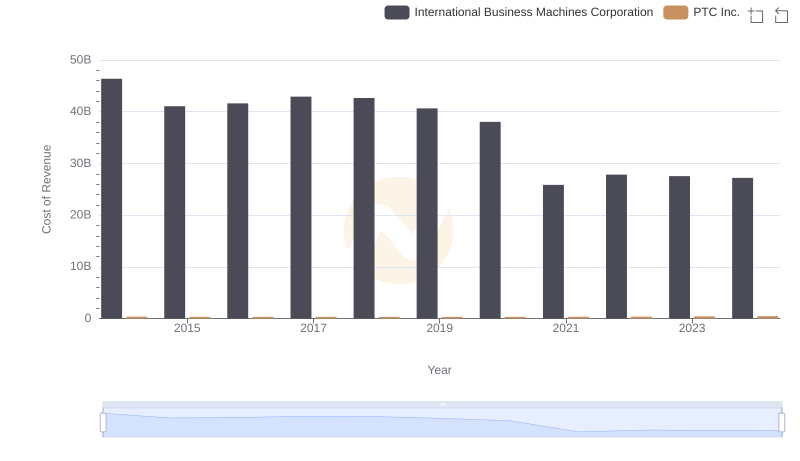
Cost Insights: Breaking Down International Business Machines Corporation and PTC Inc.'s Expenses
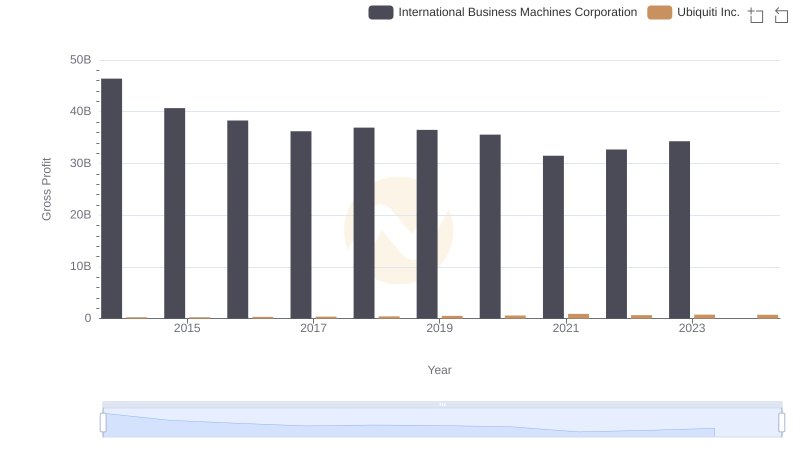
Who Generates Higher Gross Profit? International Business Machines Corporation or Ubiquiti Inc.
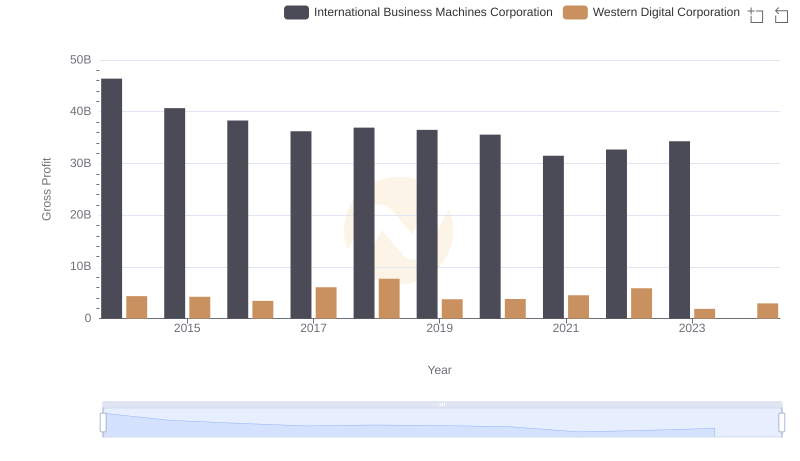
Gross Profit Trends Compared: International Business Machines Corporation vs Western Digital Corporation
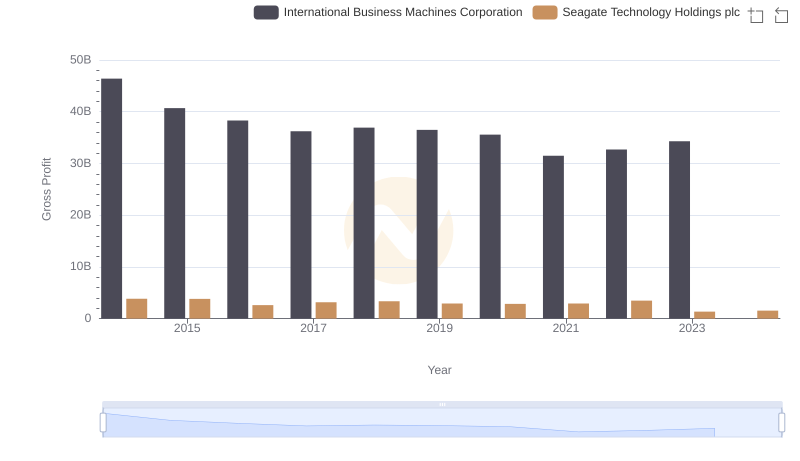
International Business Machines Corporation vs Seagate Technology Holdings plc: A Gross Profit Performance Breakdown
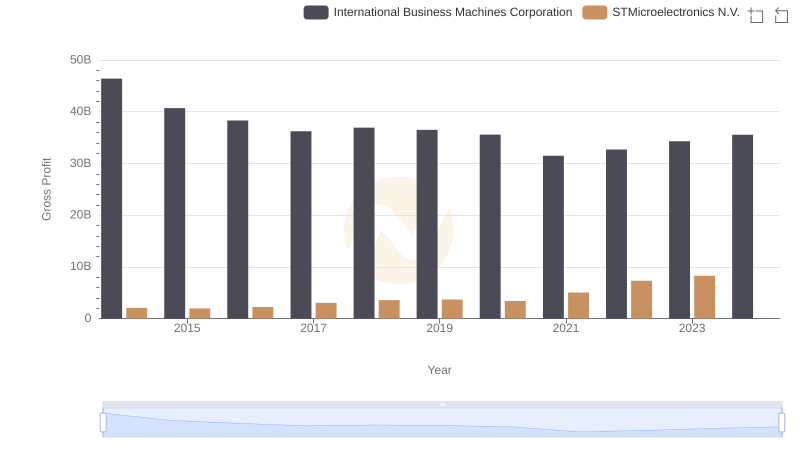
Who Generates Higher Gross Profit? International Business Machines Corporation or STMicroelectronics N.V.
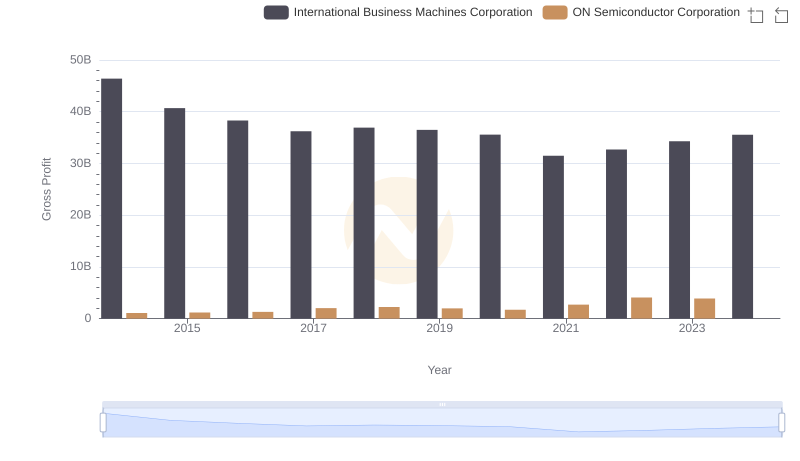
International Business Machines Corporation vs ON Semiconductor Corporation: A Gross Profit Performance Breakdown
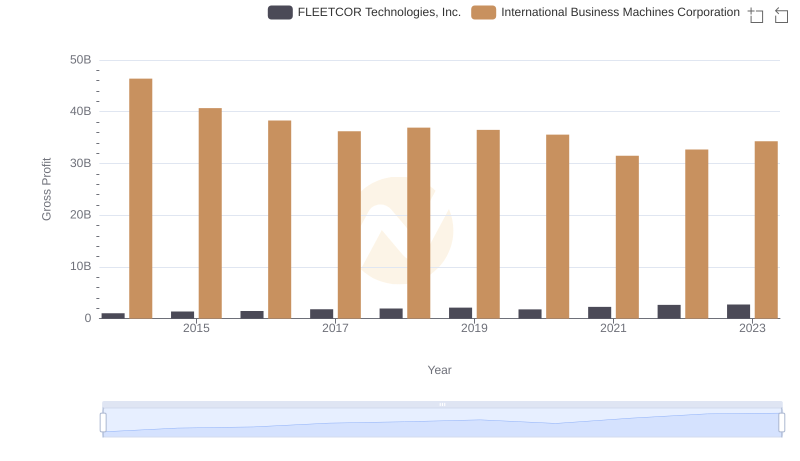
Gross Profit Comparison: International Business Machines Corporation and FLEETCOR Technologies, Inc. Trends
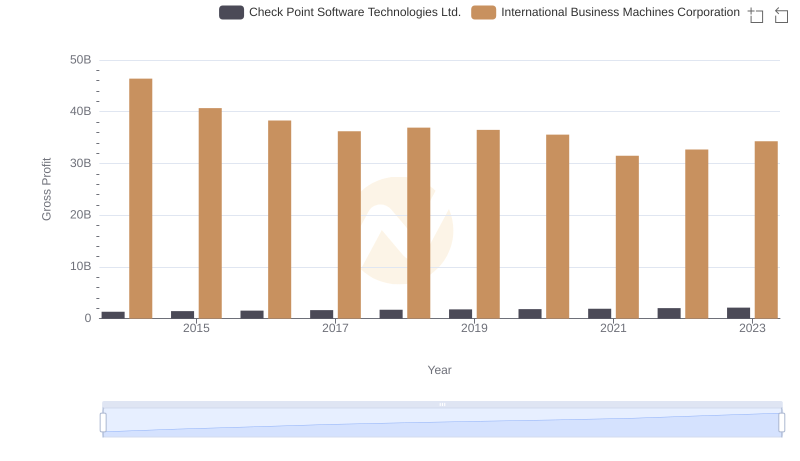
Key Insights on Gross Profit: International Business Machines Corporation vs Check Point Software Technologies Ltd.
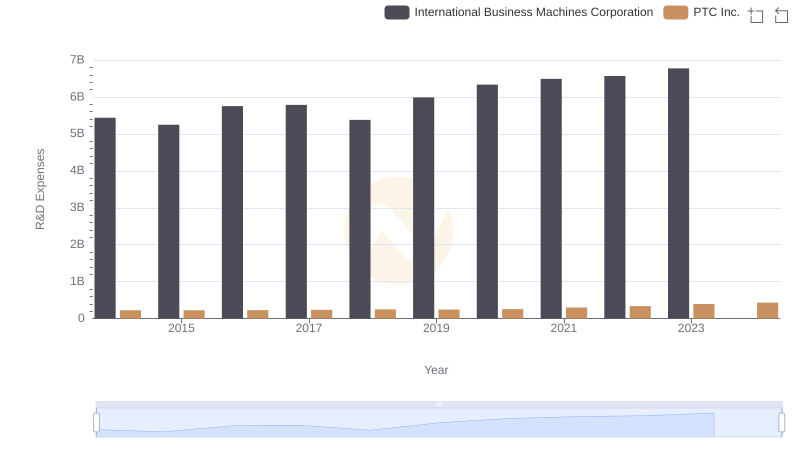
International Business Machines Corporation or PTC Inc.: Who Invests More in Innovation?
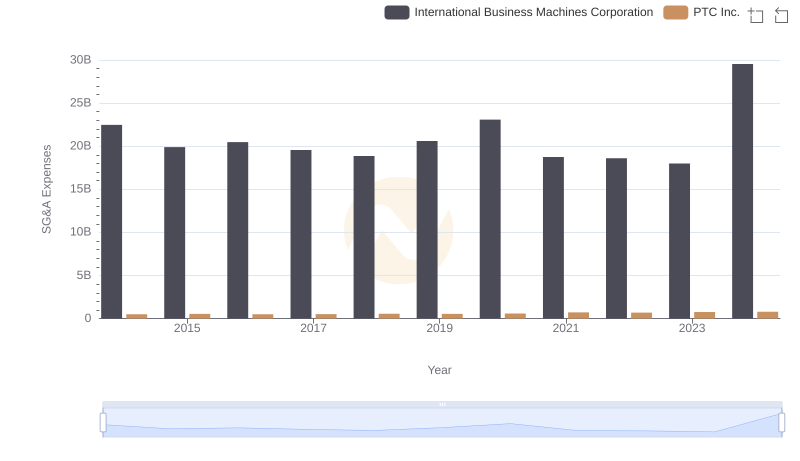
International Business Machines Corporation vs PTC Inc.: SG&A Expense Trends

EBITDA Analysis: Evaluating International Business Machines Corporation Against PTC Inc.