| __timestamp | International Business Machines Corporation | PTC Inc. |
|---|---|---|
| Wednesday, January 1, 2014 | 24962000000 | 271574000 |
| Thursday, January 1, 2015 | 20268000000 | 125699999 |
| Friday, January 1, 2016 | 17341000000 | 49244000 |
| Sunday, January 1, 2017 | 16556000000 | 127736000 |
| Monday, January 1, 2018 | 16545000000 | 157737000 |
| Tuesday, January 1, 2019 | 14609000000 | 141171000 |
| Wednesday, January 1, 2020 | 10555000000 | 291951000 |
| Friday, January 1, 2021 | 12409000000 | 564767000 |
| Saturday, January 1, 2022 | 7174000000 | 573406000 |
| Sunday, January 1, 2023 | 14693000000 | 599145000 |
| Monday, January 1, 2024 | 6015000000 | 730022000 |
Igniting the spark of knowledge
In the ever-evolving landscape of technology, the financial health of companies like International Business Machines Corporation (IBM) and PTC Inc. is crucial. Over the past decade, IBM's EBITDA has seen a significant decline, dropping from a peak in 2014 to nearly 60% less by 2024. This trend reflects the challenges faced by traditional tech giants in adapting to new market dynamics. Meanwhile, PTC Inc., a smaller player, has shown resilience with a steady increase in EBITDA, growing by over 160% from 2014 to 2024. This contrast highlights the agility of smaller firms in capitalizing on emerging opportunities. As we look to the future, the ability to innovate and adapt will be key for these companies to maintain their competitive edge in the global market.

International Business Machines Corporation and PTC Inc.: A Comprehensive Revenue Analysis
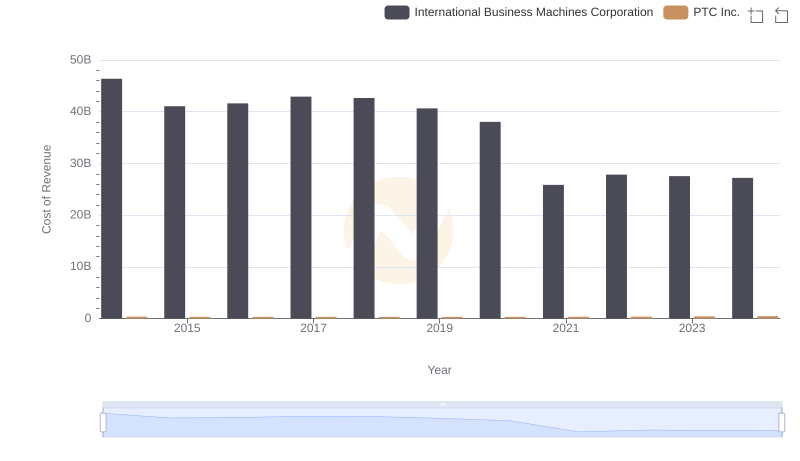
Cost Insights: Breaking Down International Business Machines Corporation and PTC Inc.'s Expenses
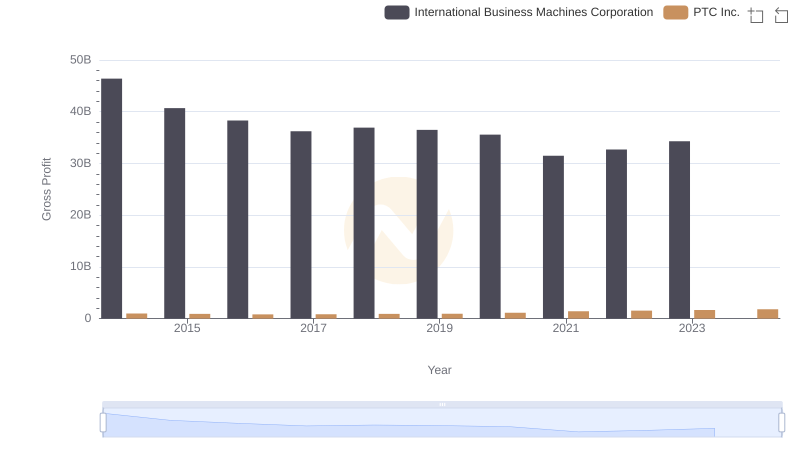
Gross Profit Analysis: Comparing International Business Machines Corporation and PTC Inc.
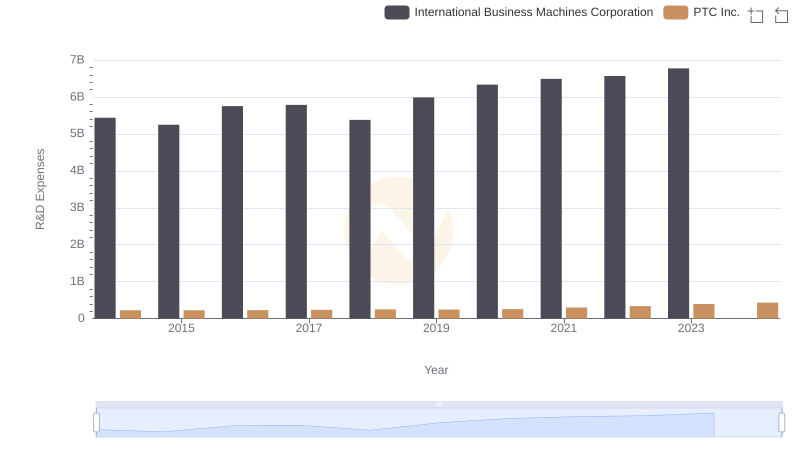
International Business Machines Corporation or PTC Inc.: Who Invests More in Innovation?
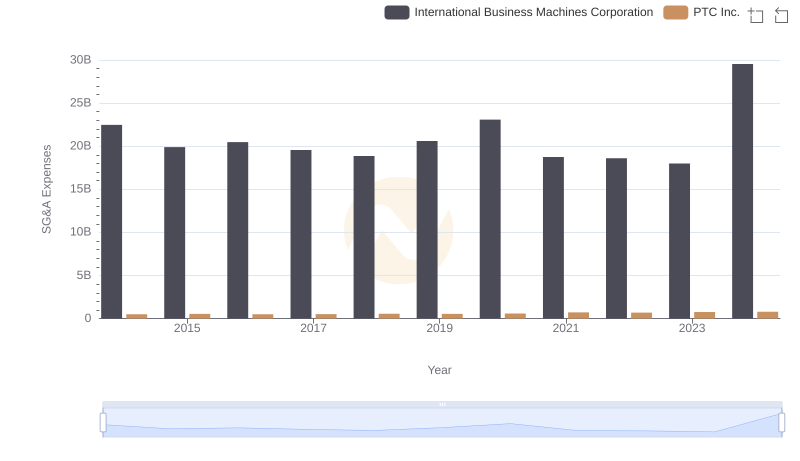
International Business Machines Corporation vs PTC Inc.: SG&A Expense Trends
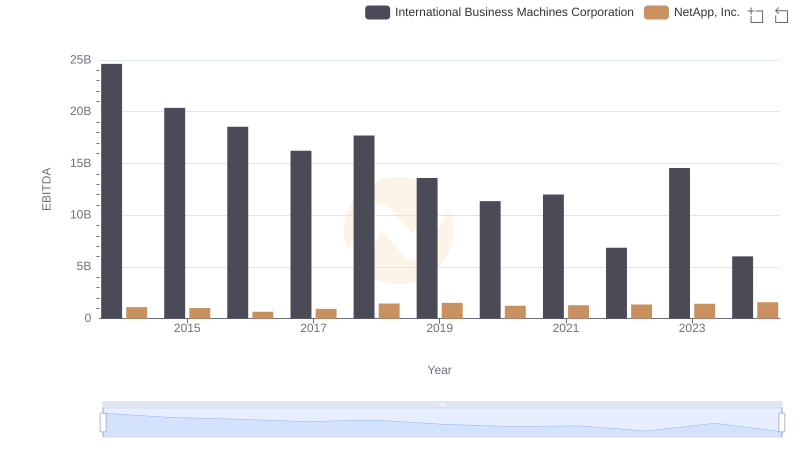
EBITDA Performance Review: International Business Machines Corporation vs NetApp, Inc.
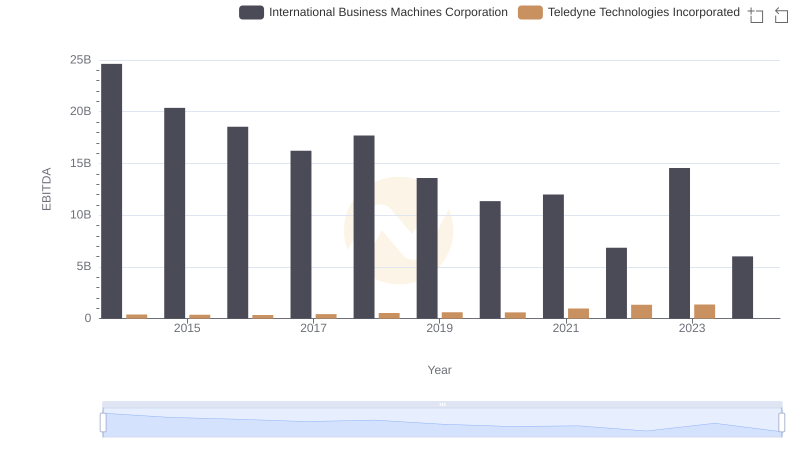
A Professional Review of EBITDA: International Business Machines Corporation Compared to Teledyne Technologies Incorporated
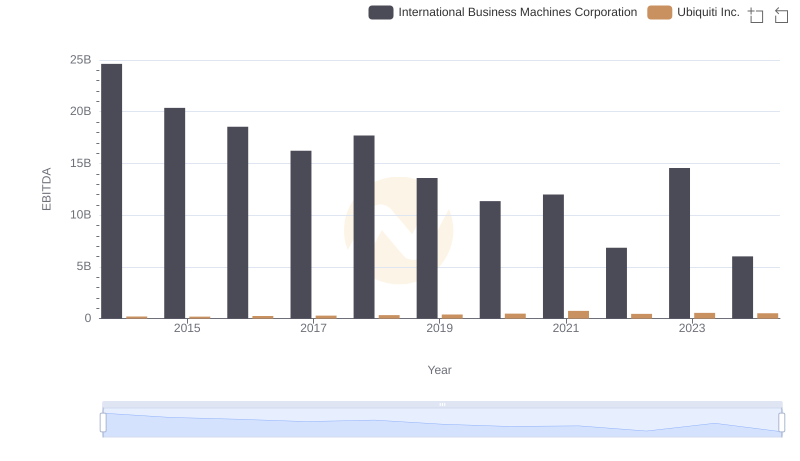
EBITDA Analysis: Evaluating International Business Machines Corporation Against Ubiquiti Inc.
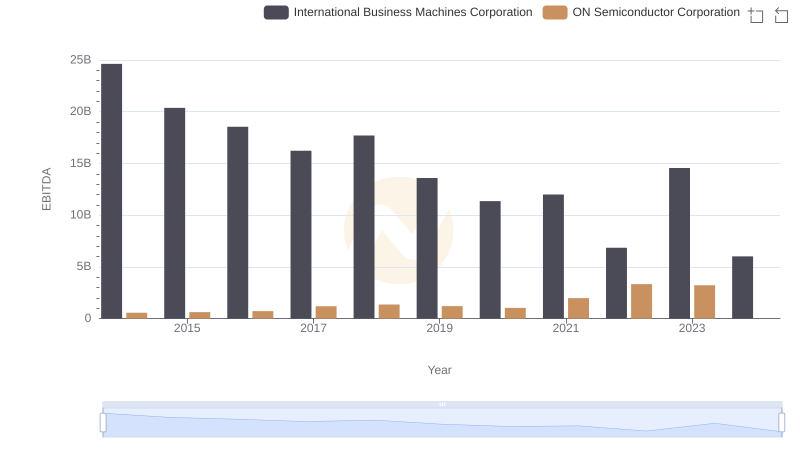
EBITDA Analysis: Evaluating International Business Machines Corporation Against ON Semiconductor Corporation
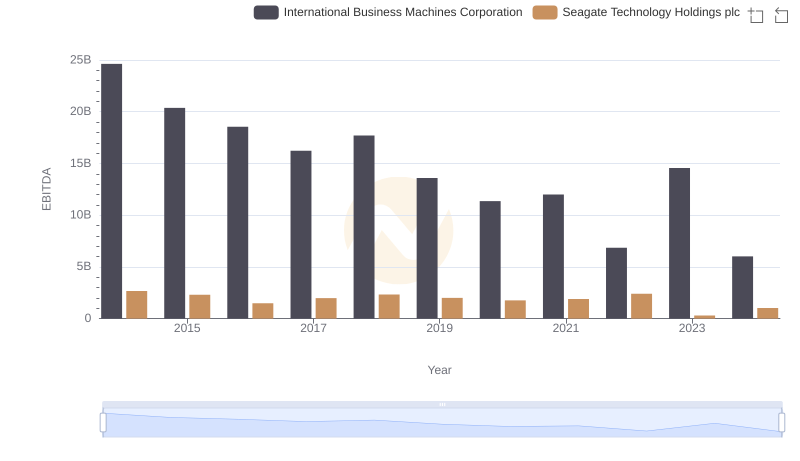
International Business Machines Corporation vs Seagate Technology Holdings plc: In-Depth EBITDA Performance Comparison

International Business Machines Corporation vs FLEETCOR Technologies, Inc.: In-Depth EBITDA Performance Comparison
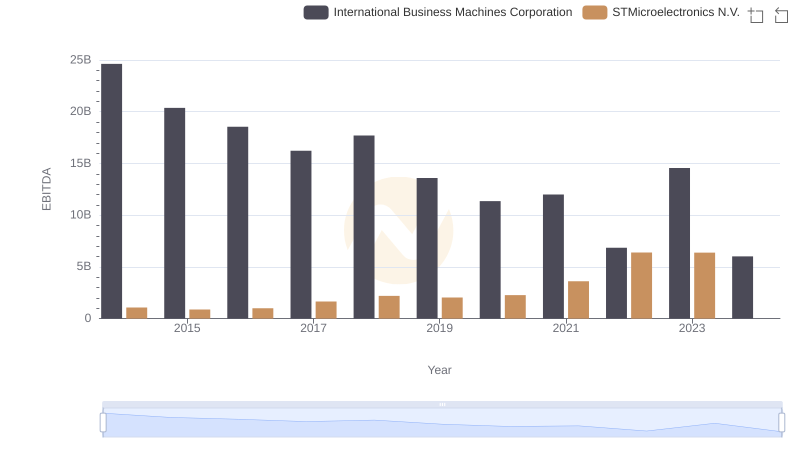
Professional EBITDA Benchmarking: International Business Machines Corporation vs STMicroelectronics N.V.