| __timestamp | International Business Machines Corporation | PTC Inc. |
|---|---|---|
| Wednesday, January 1, 2014 | 46386000000 | 373683000 |
| Thursday, January 1, 2015 | 41057000000 | 334734000 |
| Friday, January 1, 2016 | 41403000000 | 325665000 |
| Sunday, January 1, 2017 | 42196000000 | 329019000 |
| Monday, January 1, 2018 | 42655000000 | 326194000 |
| Tuesday, January 1, 2019 | 26181000000 | 325378000 |
| Wednesday, January 1, 2020 | 24314000000 | 334271000 |
| Friday, January 1, 2021 | 25865000000 | 371102000 |
| Saturday, January 1, 2022 | 27842000000 | 385980000 |
| Sunday, January 1, 2023 | 27560000000 | 441006000 |
| Monday, January 1, 2024 | 27202000000 | 486834000 |
In pursuit of knowledge
In the ever-evolving landscape of technology, understanding the cost dynamics of industry giants like International Business Machines Corporation (IBM) and PTC Inc. is crucial. Over the past decade, IBM's cost of revenue has seen a significant decline, dropping by approximately 41% from 2014 to 2024. This trend reflects IBM's strategic shift towards more efficient operations and possibly a focus on high-margin services. In contrast, PTC Inc., a leader in digital transformation solutions, has experienced a steady increase in its cost of revenue, rising by about 30% over the same period. This growth could indicate PTC's expanding market presence and investment in innovation. The data highlights a fascinating divergence in cost strategies between these two tech titans, offering valuable insights for investors and industry analysts alike.

International Business Machines Corporation and PTC Inc.: A Comprehensive Revenue Analysis
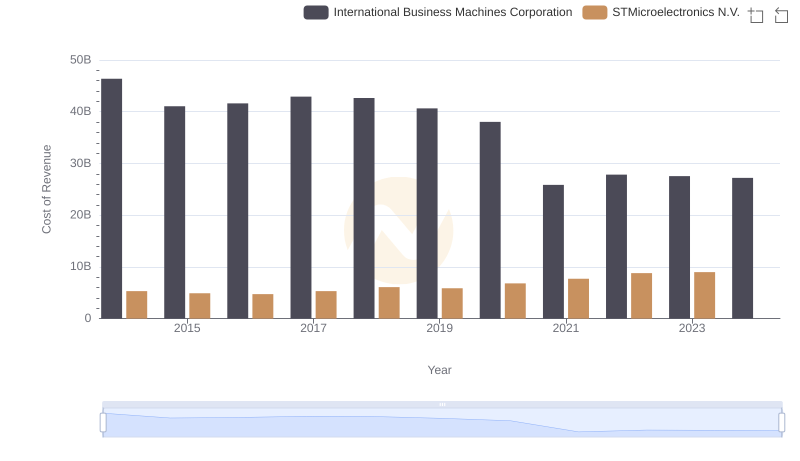
Cost of Revenue Comparison: International Business Machines Corporation vs STMicroelectronics N.V.
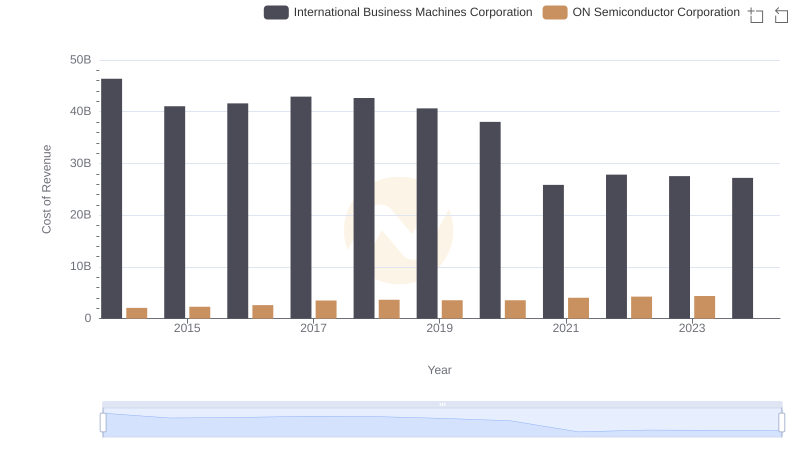
Cost Insights: Breaking Down International Business Machines Corporation and ON Semiconductor Corporation's Expenses

International Business Machines Corporation vs Seagate Technology Holdings plc: Efficiency in Cost of Revenue Explored
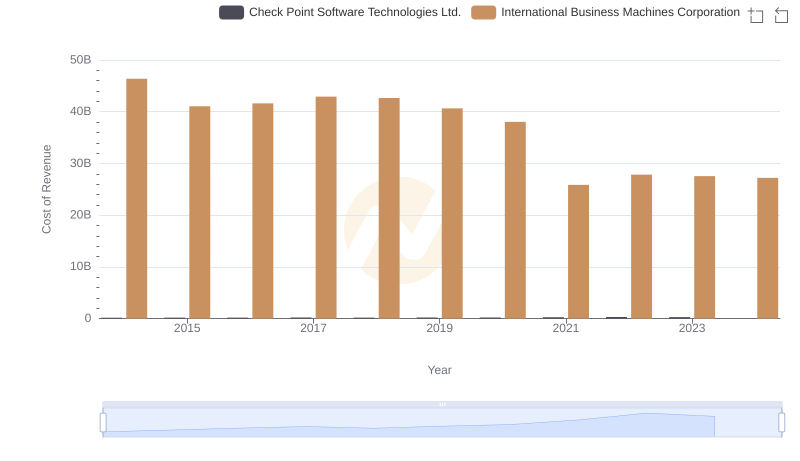
Cost of Revenue: Key Insights for International Business Machines Corporation and Check Point Software Technologies Ltd.

Cost Insights: Breaking Down International Business Machines Corporation and Pure Storage, Inc.'s Expenses
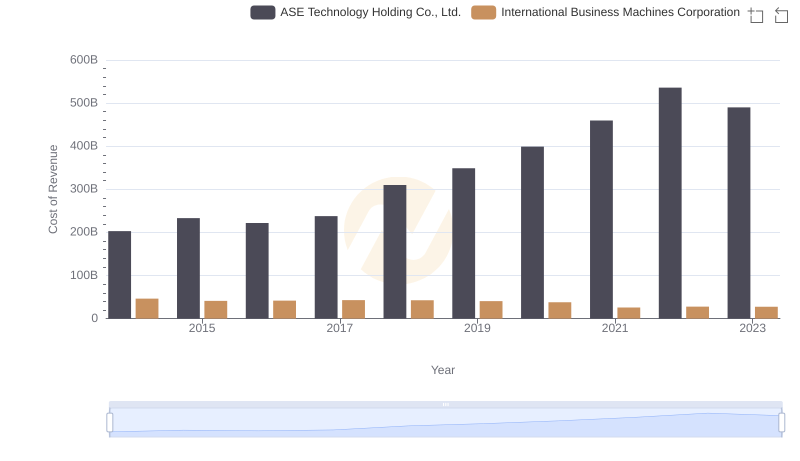
International Business Machines Corporation vs ASE Technology Holding Co., Ltd.: Efficiency in Cost of Revenue Explored
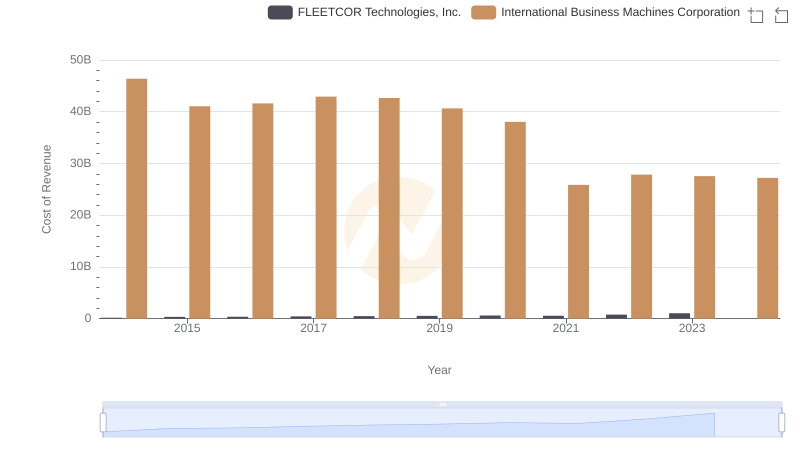
Analyzing Cost of Revenue: International Business Machines Corporation and FLEETCOR Technologies, Inc.
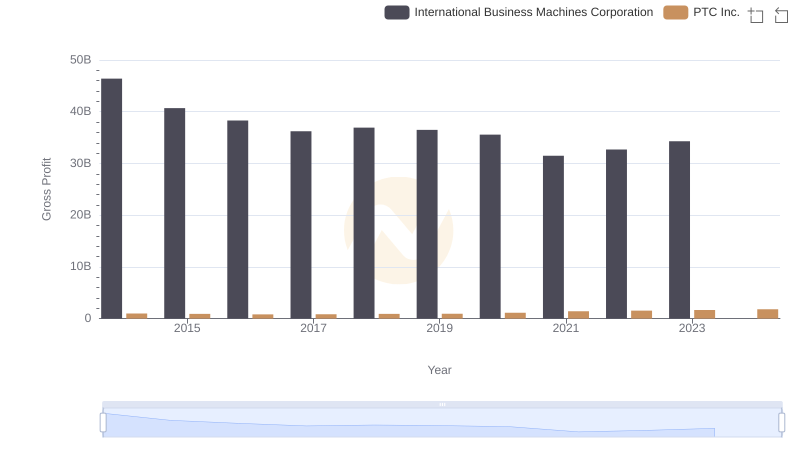
Gross Profit Analysis: Comparing International Business Machines Corporation and PTC Inc.
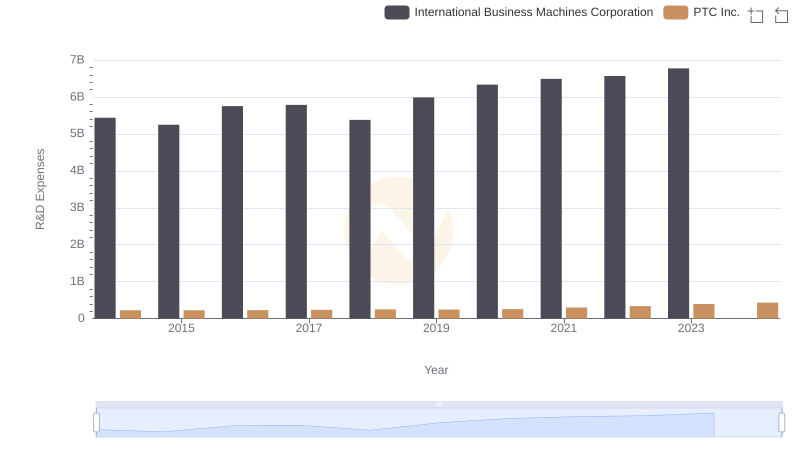
International Business Machines Corporation or PTC Inc.: Who Invests More in Innovation?
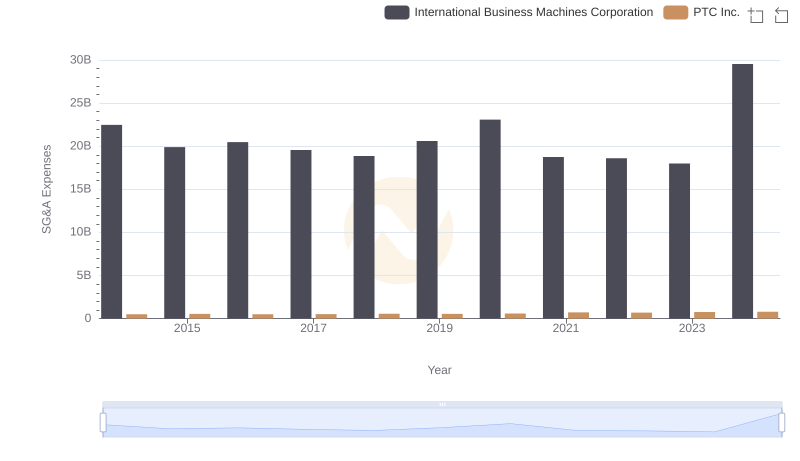
International Business Machines Corporation vs PTC Inc.: SG&A Expense Trends

EBITDA Analysis: Evaluating International Business Machines Corporation Against PTC Inc.