| __timestamp | International Business Machines Corporation | Ubiquiti Inc. |
|---|---|---|
| Wednesday, January 1, 2014 | 22472000000 | 23560000 |
| Thursday, January 1, 2015 | 19894000000 | 21607000 |
| Friday, January 1, 2016 | 20279000000 | 33269000 |
| Sunday, January 1, 2017 | 19680000000 | 36853000 |
| Monday, January 1, 2018 | 19366000000 | 43121000 |
| Tuesday, January 1, 2019 | 18724000000 | 43237000 |
| Wednesday, January 1, 2020 | 20561000000 | 40569000 |
| Friday, January 1, 2021 | 18745000000 | 53513000 |
| Saturday, January 1, 2022 | 17483000000 | 69859000 |
| Sunday, January 1, 2023 | 17997000000 | 70993000 |
| Monday, January 1, 2024 | 29536000000 | 80997000 |
Unleashing insights
In the ever-evolving landscape of technology, the financial strategies of companies like International Business Machines Corporation (IBM) and Ubiquiti Inc. offer a fascinating glimpse into their operational priorities. Over the past decade, IBM's Selling, General, and Administrative (SG&A) expenses have shown a steady trend, peaking in 2024 with a 42% increase from 2023. This reflects IBM's expansive global operations and its commitment to maintaining a robust administrative framework. In contrast, Ubiquiti Inc., a leader in wireless data communication products, has seen its SG&A expenses grow by over 200% since 2014, indicating a strategic push towards scaling its operations. While IBM's expenses dwarf those of Ubiquiti, the latter's rapid growth underscores its aggressive market expansion. This financial narrative not only highlights the contrasting business models but also the dynamic nature of the tech industry.
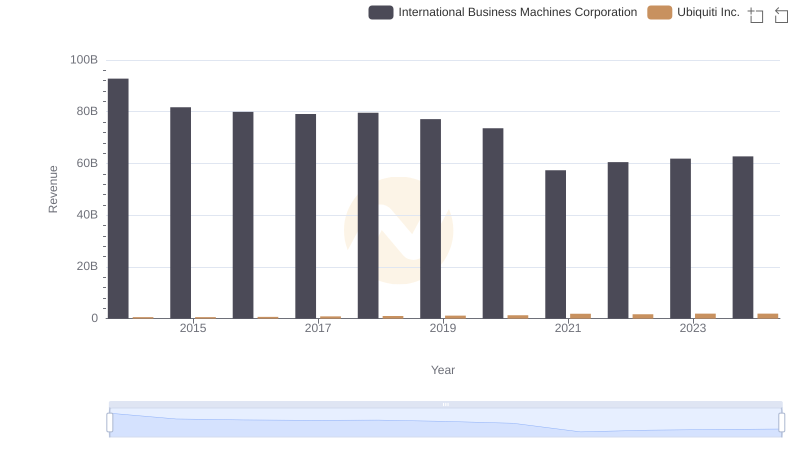
Breaking Down Revenue Trends: International Business Machines Corporation vs Ubiquiti Inc.
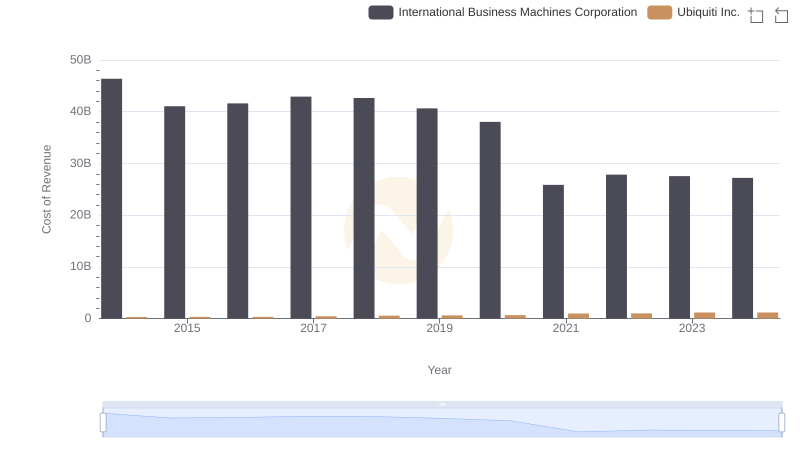
Comparing Cost of Revenue Efficiency: International Business Machines Corporation vs Ubiquiti Inc.
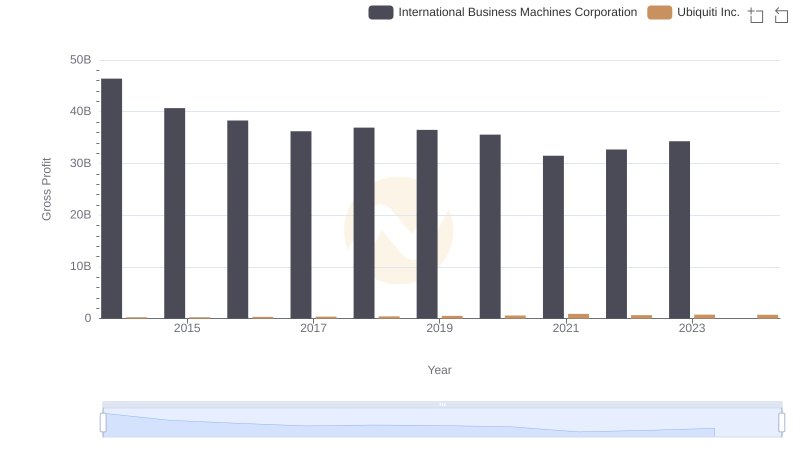
Who Generates Higher Gross Profit? International Business Machines Corporation or Ubiquiti Inc.
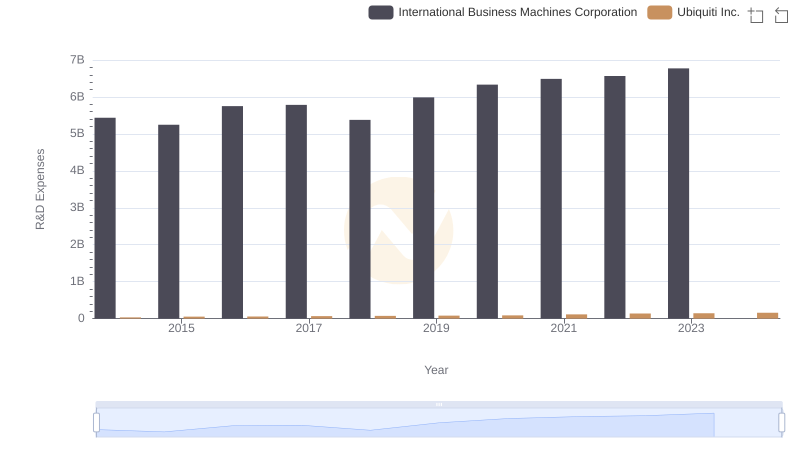
International Business Machines Corporation vs Ubiquiti Inc.: Strategic Focus on R&D Spending
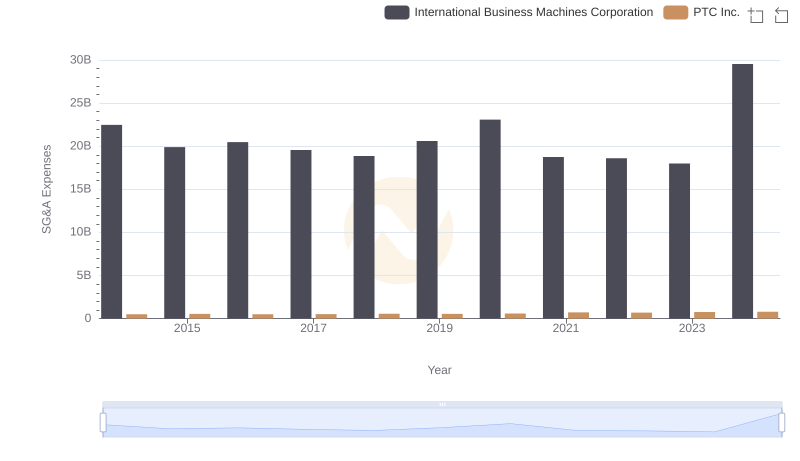
International Business Machines Corporation vs PTC Inc.: SG&A Expense Trends
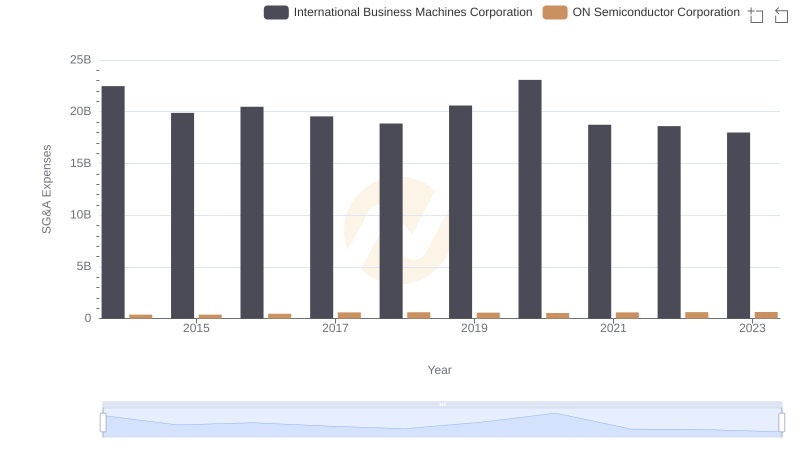
Breaking Down SG&A Expenses: International Business Machines Corporation vs ON Semiconductor Corporation
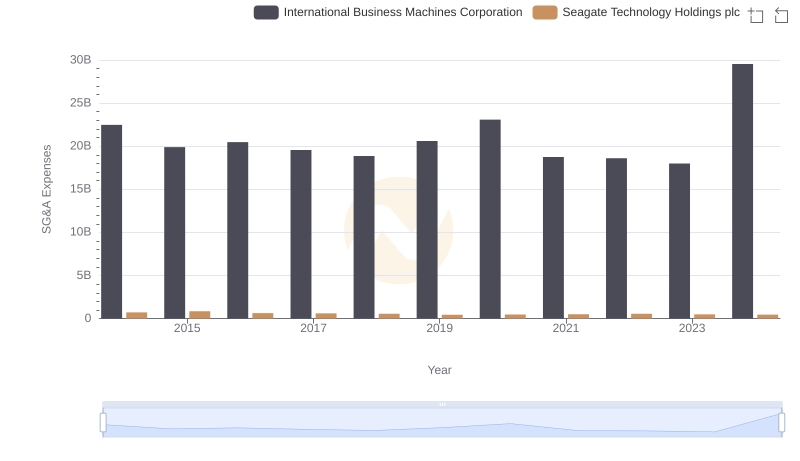
Cost Management Insights: SG&A Expenses for International Business Machines Corporation and Seagate Technology Holdings plc
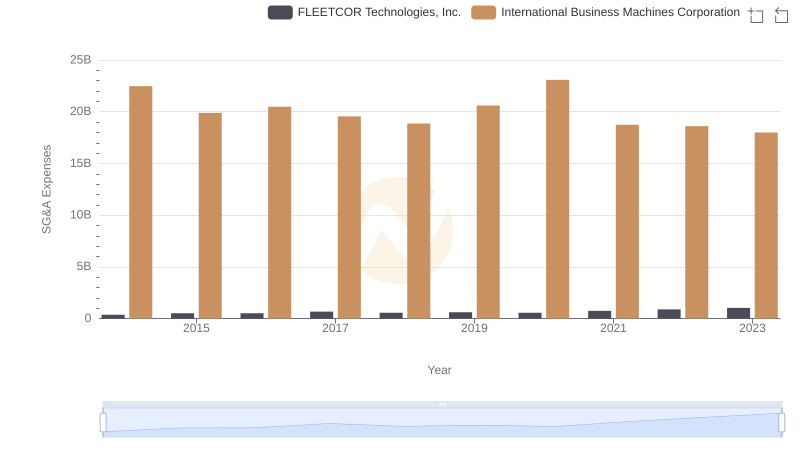
International Business Machines Corporation vs FLEETCOR Technologies, Inc.: SG&A Expense Trends
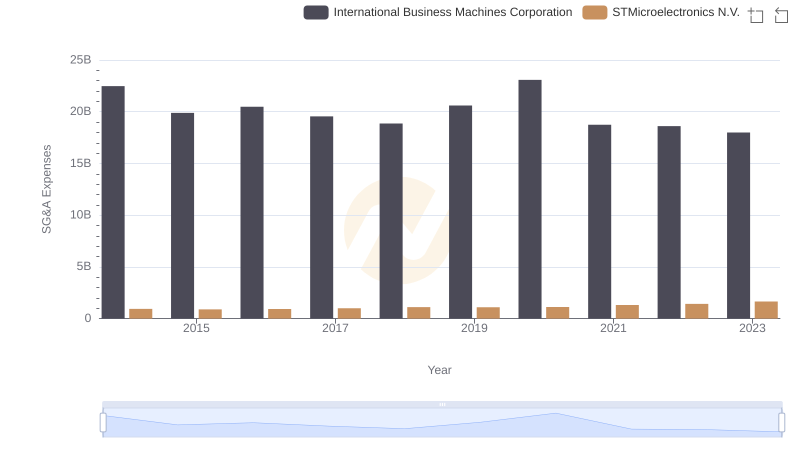
International Business Machines Corporation or STMicroelectronics N.V.: Who Manages SG&A Costs Better?
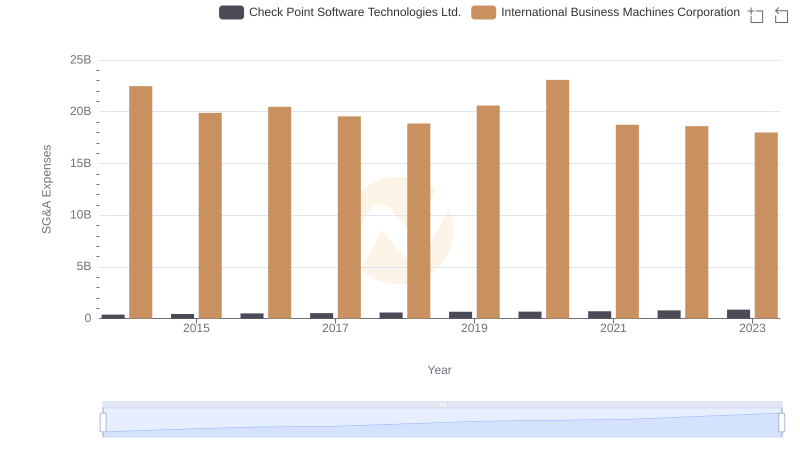
Operational Costs Compared: SG&A Analysis of International Business Machines Corporation and Check Point Software Technologies Ltd.
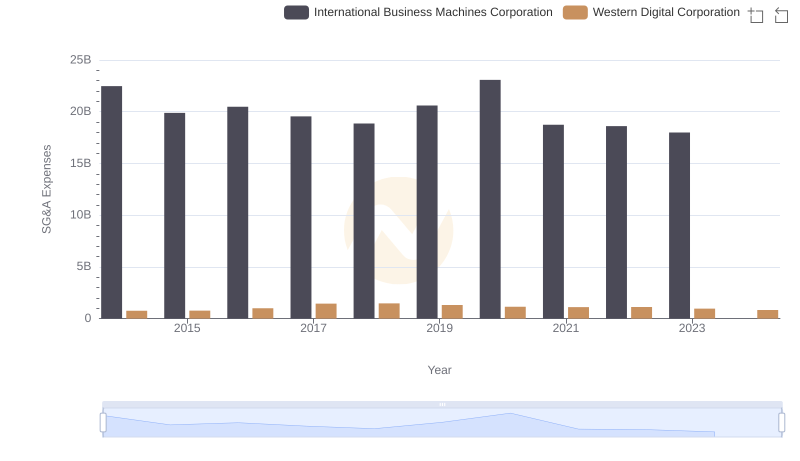
Selling, General, and Administrative Costs: International Business Machines Corporation vs Western Digital Corporation
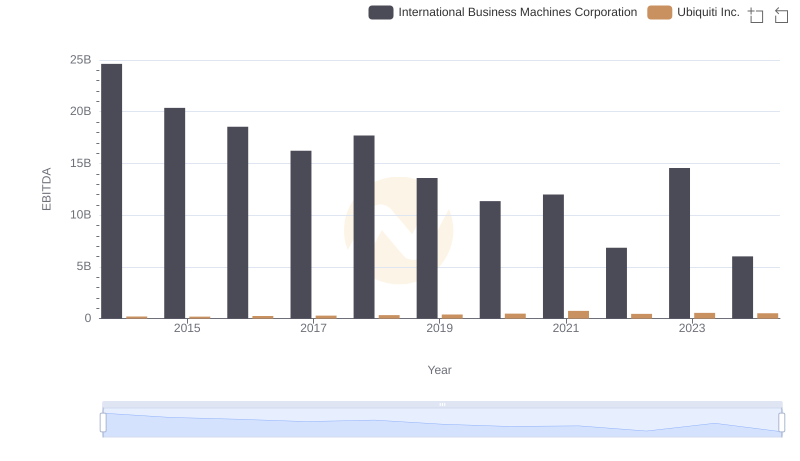
EBITDA Analysis: Evaluating International Business Machines Corporation Against Ubiquiti Inc.