| __timestamp | Fiserv, Inc. | International Business Machines Corporation |
|---|---|---|
| Wednesday, January 1, 2014 | 2185000000 | 46407000000 |
| Thursday, January 1, 2015 | 2345000000 | 40684000000 |
| Friday, January 1, 2016 | 2546000000 | 38516000000 |
| Sunday, January 1, 2017 | 2672000000 | 36943000000 |
| Monday, January 1, 2018 | 2754000000 | 36936000000 |
| Tuesday, January 1, 2019 | 4878000000 | 31533000000 |
| Wednesday, January 1, 2020 | 7040000000 | 30865000000 |
| Friday, January 1, 2021 | 8098000000 | 31486000000 |
| Saturday, January 1, 2022 | 9745000000 | 32687000000 |
| Sunday, January 1, 2023 | 11423000000 | 34300000000 |
| Monday, January 1, 2024 | 20456000000 | 35551000000 |
Infusing magic into the data realm
In the ever-evolving landscape of technology and financial services, the gross profit trends of International Business Machines Corporation (IBM) and Fiserv, Inc. offer a fascinating glimpse into their financial health over the past decade. From 2014 to 2023, IBM consistently maintained a robust gross profit, peaking at approximately $46 billion in 2014. However, a gradual decline saw it settle around $34 billion by 2023, reflecting a 26% decrease. In contrast, Fiserv's gross profit trajectory tells a story of growth and resilience. Starting at $2.2 billion in 2014, Fiserv experienced a remarkable 423% increase, reaching $11.4 billion in 2023. This stark contrast highlights Fiserv's aggressive expansion and adaptation in the financial services sector, while IBM's figures suggest a strategic shift or market challenges. Notably, data for 2024 is incomplete, leaving room for speculation on future trends.
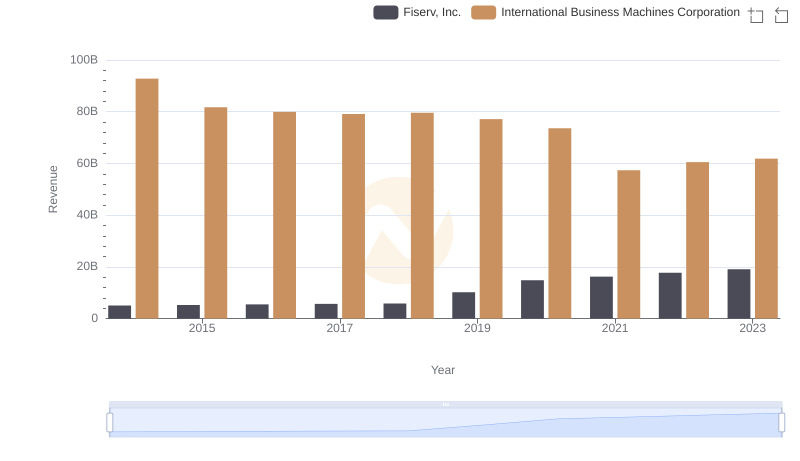
Breaking Down Revenue Trends: International Business Machines Corporation vs Fiserv, Inc.
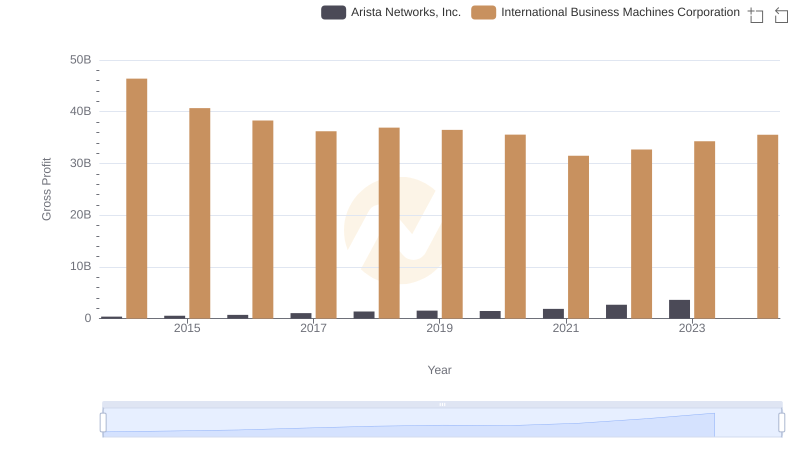
Who Generates Higher Gross Profit? International Business Machines Corporation or Arista Networks, Inc.
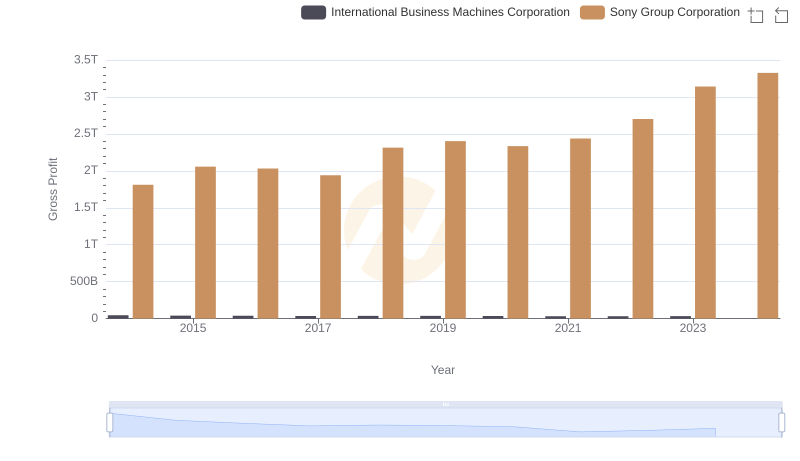
Who Generates Higher Gross Profit? International Business Machines Corporation or Sony Group Corporation
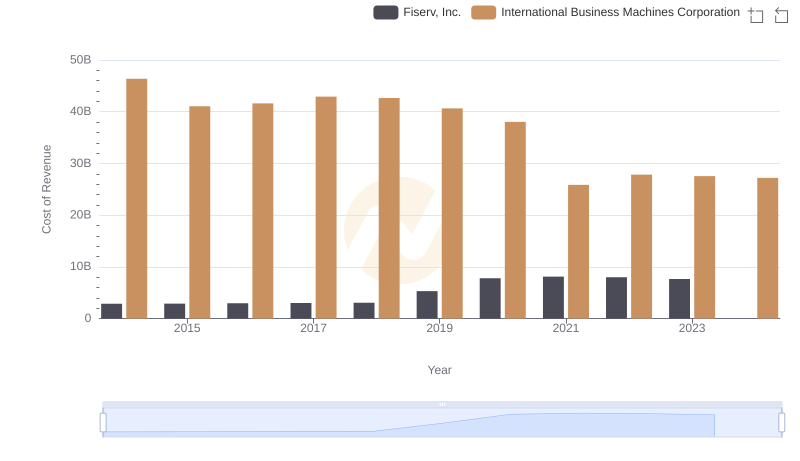
Analyzing Cost of Revenue: International Business Machines Corporation and Fiserv, Inc.
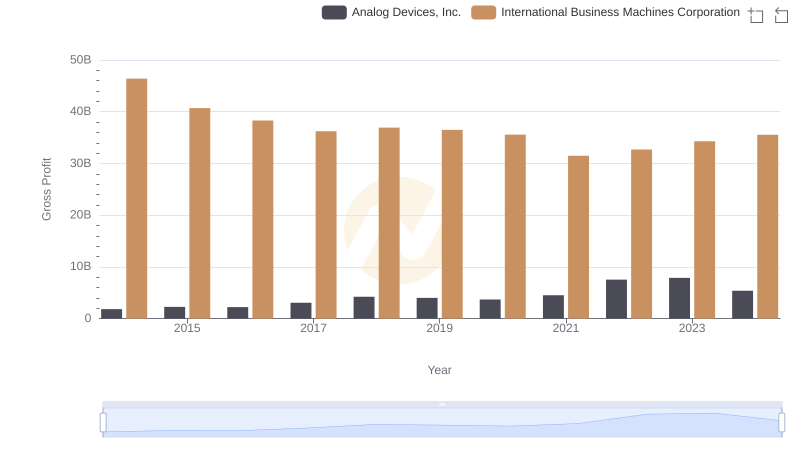
Who Generates Higher Gross Profit? International Business Machines Corporation or Analog Devices, Inc.
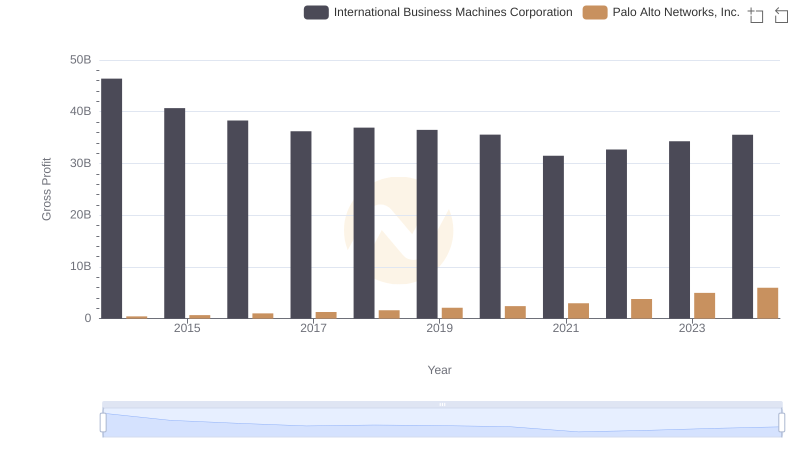
Gross Profit Trends Compared: International Business Machines Corporation vs Palo Alto Networks, Inc.
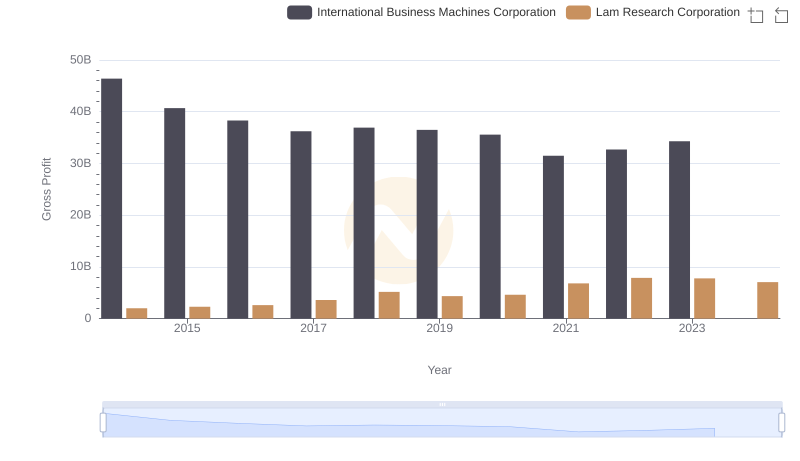
International Business Machines Corporation and Lam Research Corporation: A Detailed Gross Profit Analysis
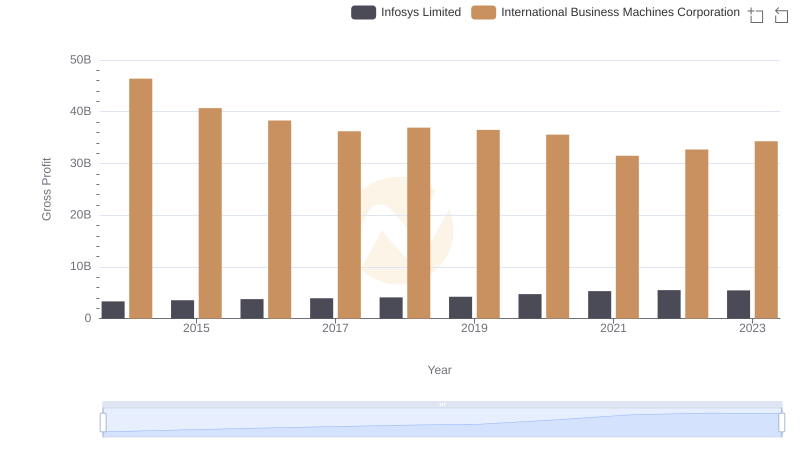
Key Insights on Gross Profit: International Business Machines Corporation vs Infosys Limited

Gross Profit Analysis: Comparing International Business Machines Corporation and Intel Corporation
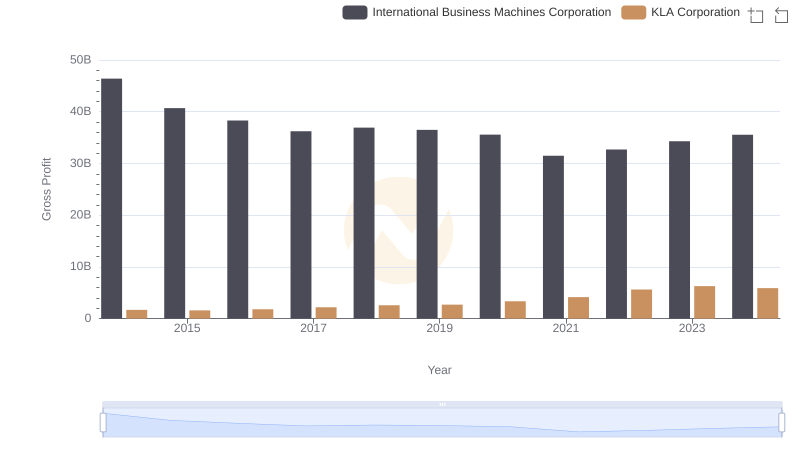
International Business Machines Corporation vs KLA Corporation: A Gross Profit Performance Breakdown
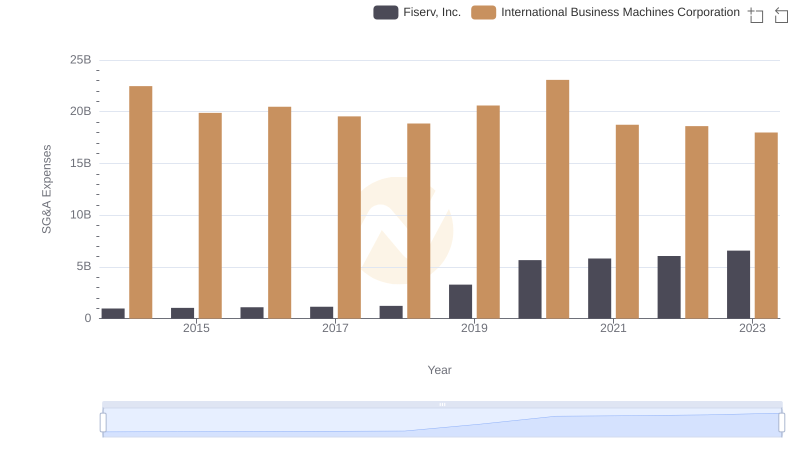
Comparing SG&A Expenses: International Business Machines Corporation vs Fiserv, Inc. Trends and Insights
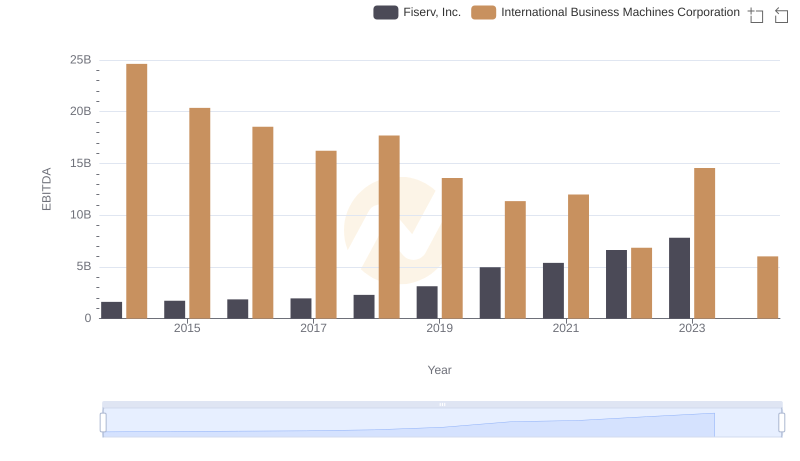
International Business Machines Corporation vs Fiserv, Inc.: In-Depth EBITDA Performance Comparison