| __timestamp | International Business Machines Corporation | MicroStrategy Incorporated |
|---|---|---|
| Wednesday, January 1, 2014 | 46386000000 | 135210000 |
| Thursday, January 1, 2015 | 41057000000 | 101108000 |
| Friday, January 1, 2016 | 41403000000 | 93147000 |
| Sunday, January 1, 2017 | 42196000000 | 96649000 |
| Monday, January 1, 2018 | 42655000000 | 99499000 |
| Tuesday, January 1, 2019 | 26181000000 | 99974000 |
| Wednesday, January 1, 2020 | 24314000000 | 91055000 |
| Friday, January 1, 2021 | 25865000000 | 91909000 |
| Saturday, January 1, 2022 | 27842000000 | 102989000 |
| Sunday, January 1, 2023 | 27560000000 | 109944000 |
| Monday, January 1, 2024 | 27202000000 | 129468000 |
In pursuit of knowledge
In the ever-evolving landscape of technology, understanding cost structures is crucial. From 2014 to 2023, International Business Machines Corporation (IBM) and MicroStrategy Incorporated have shown distinct trends in their cost of revenue. IBM, a titan in the tech industry, saw a significant decline of approximately 41% in its cost of revenue, from 2014's peak to 2023. This reduction reflects strategic shifts and efficiency improvements. In contrast, MicroStrategy's cost of revenue remained relatively stable, with minor fluctuations, indicating a consistent operational approach.
These insights provide a window into the financial strategies of two influential tech companies.
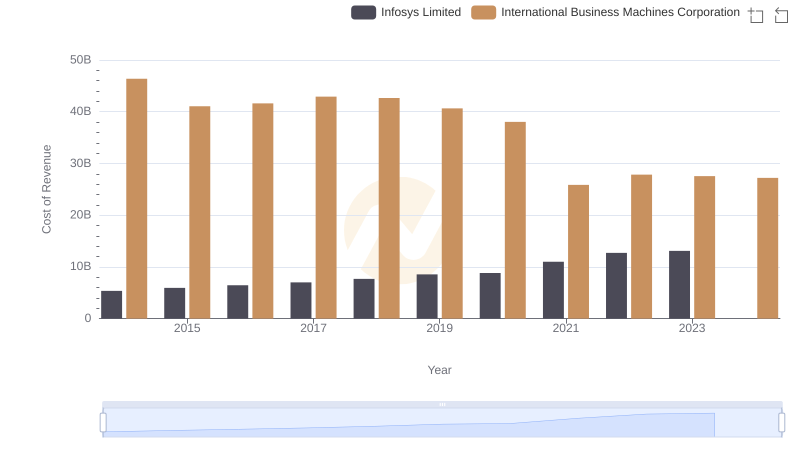
International Business Machines Corporation vs Infosys Limited: Efficiency in Cost of Revenue Explored
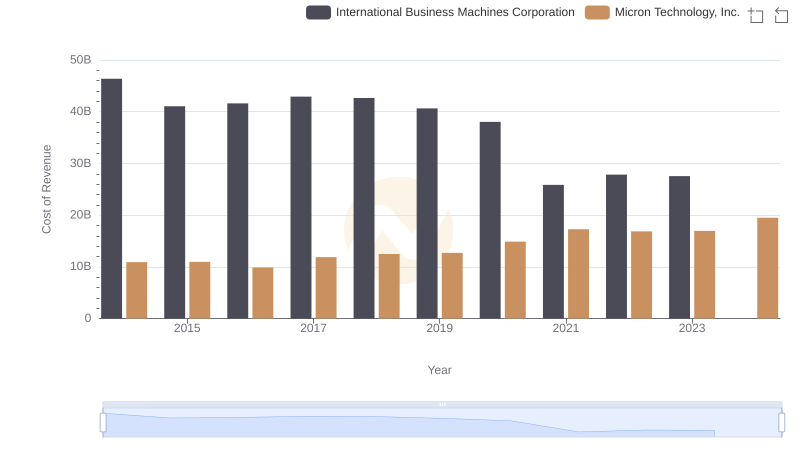
Cost of Revenue: Key Insights for International Business Machines Corporation and Micron Technology, Inc.
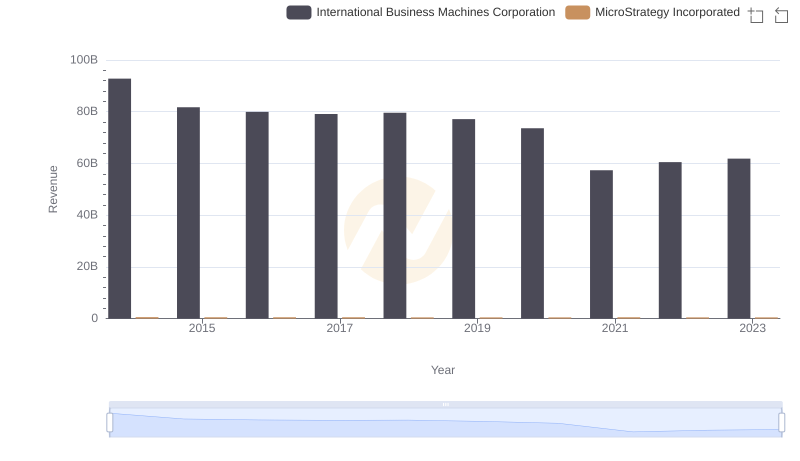
Revenue Insights: International Business Machines Corporation and MicroStrategy Incorporated Performance Compared
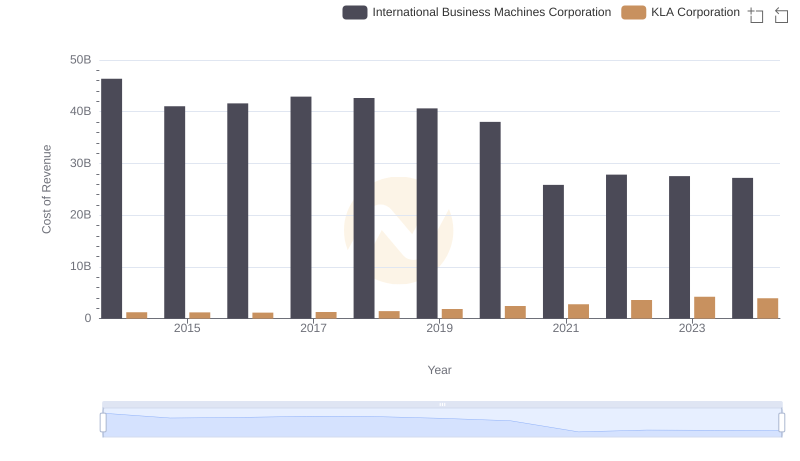
Cost Insights: Breaking Down International Business Machines Corporation and KLA Corporation's Expenses
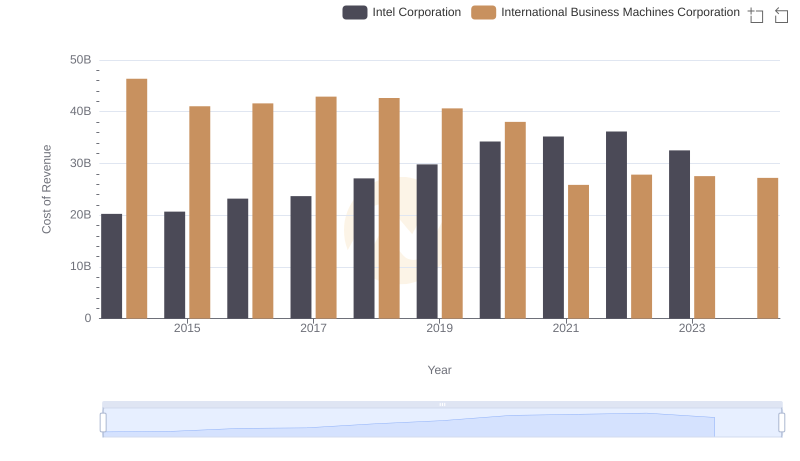
Cost Insights: Breaking Down International Business Machines Corporation and Intel Corporation's Expenses
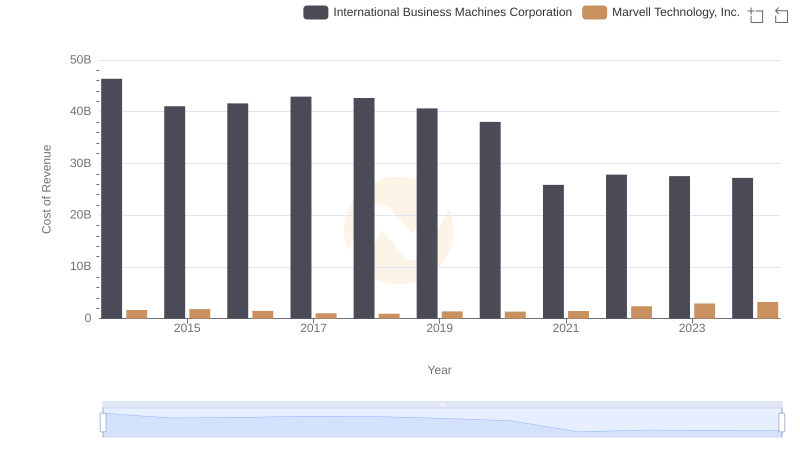
Cost Insights: Breaking Down International Business Machines Corporation and Marvell Technology, Inc.'s Expenses
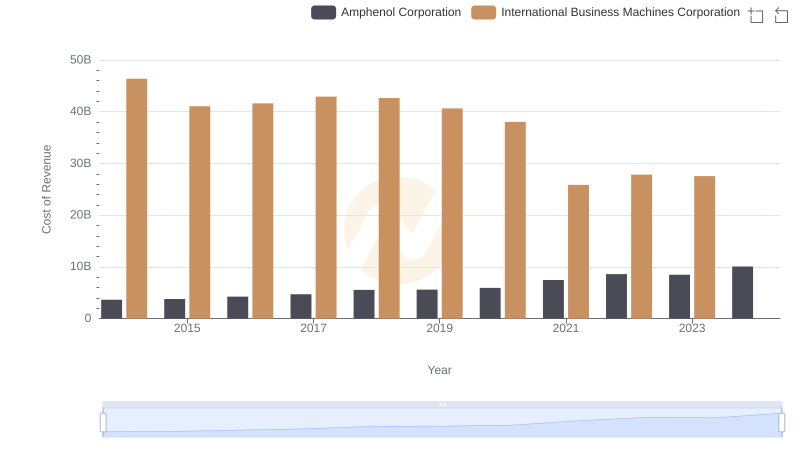
Comparing Cost of Revenue Efficiency: International Business Machines Corporation vs Amphenol Corporation
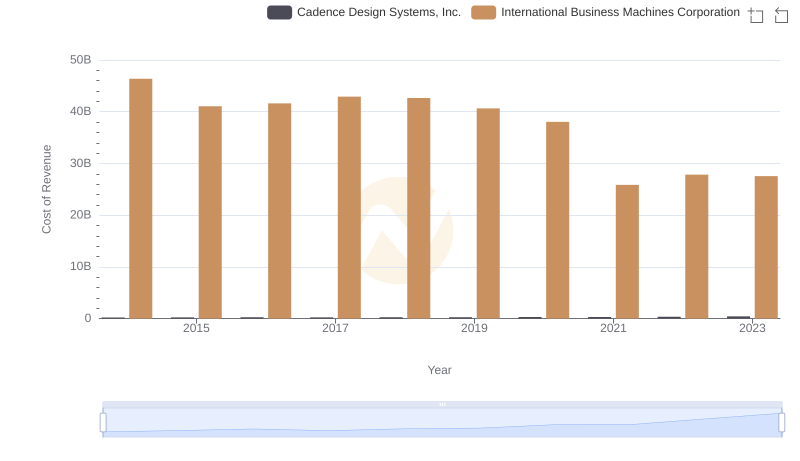
Cost of Revenue Comparison: International Business Machines Corporation vs Cadence Design Systems, Inc.
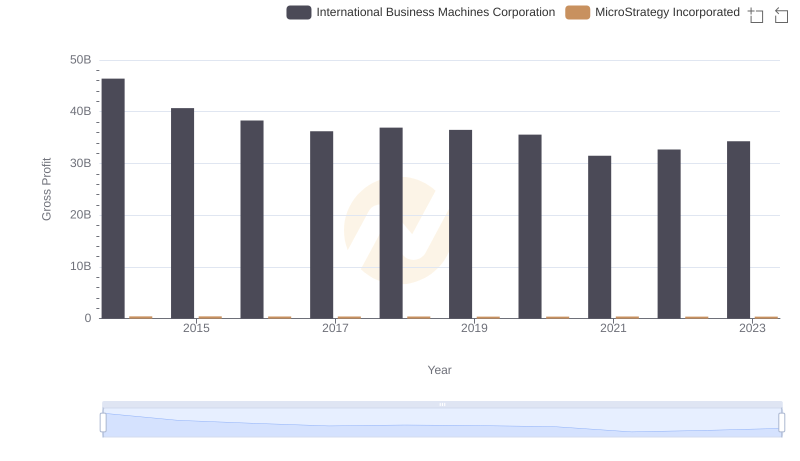
International Business Machines Corporation vs MicroStrategy Incorporated: A Gross Profit Performance Breakdown

Cost of Revenue Comparison: International Business Machines Corporation vs Synopsys, Inc.
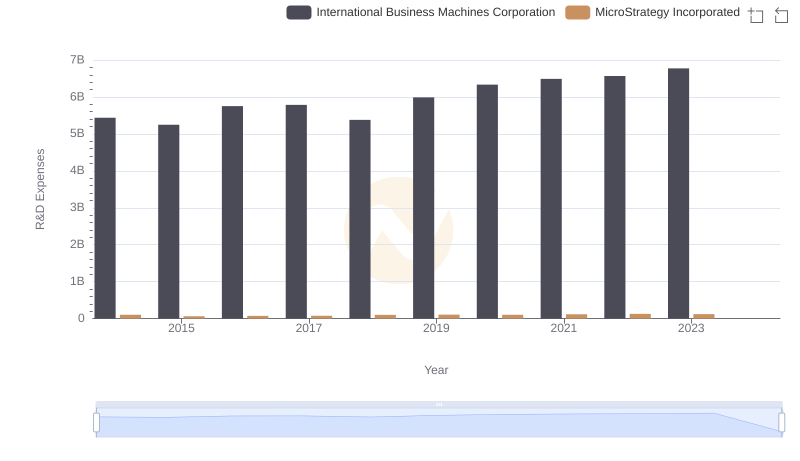
R&D Spending Showdown: International Business Machines Corporation vs MicroStrategy Incorporated
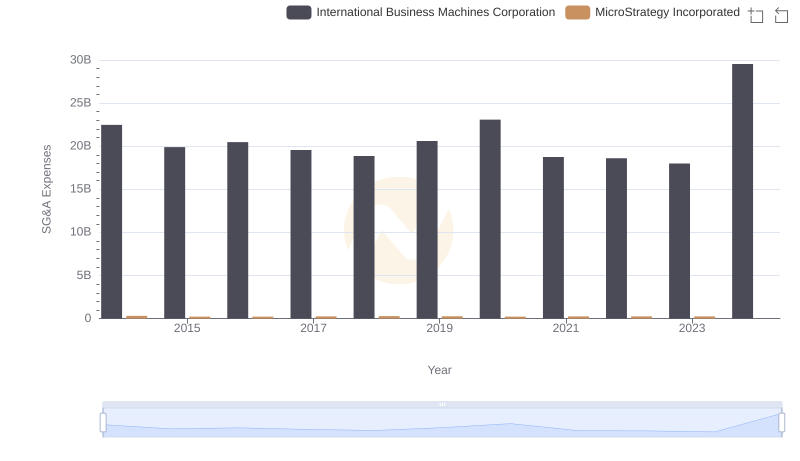
International Business Machines Corporation or MicroStrategy Incorporated: Who Manages SG&A Costs Better?