| __timestamp | International Business Machines Corporation | MicroStrategy Incorporated |
|---|---|---|
| Wednesday, January 1, 2014 | 92793000000 | 579830000 |
| Thursday, January 1, 2015 | 81742000000 | 529869000 |
| Friday, January 1, 2016 | 79920000000 | 512161000 |
| Sunday, January 1, 2017 | 79139000000 | 504543000 |
| Monday, January 1, 2018 | 79591000000 | 497638000 |
| Tuesday, January 1, 2019 | 57714000000 | 486327000 |
| Wednesday, January 1, 2020 | 55179000000 | 480735000 |
| Friday, January 1, 2021 | 57351000000 | 510762000 |
| Saturday, January 1, 2022 | 60530000000 | 499264000 |
| Sunday, January 1, 2023 | 61860000000 | 496261000 |
| Monday, January 1, 2024 | 62753000000 | 463456000 |
Unlocking the unknown
In the ever-evolving tech landscape, revenue performance is a key indicator of a company's market position. Over the past decade, International Business Machines Corporation (IBM) and MicroStrategy Incorporated have showcased contrasting revenue trajectories. IBM, a stalwart in the tech industry, saw its revenue peak in 2014, with a gradual decline of approximately 32% by 2021. However, recent years have shown a modest recovery, with a 9% increase from 2021 to 2024. In contrast, MicroStrategy's revenue has remained relatively stable, with minor fluctuations around the $500 million mark, highlighting its niche market focus. Notably, data for 2024 is missing for MicroStrategy, indicating potential reporting delays or strategic shifts. This comparison underscores the dynamic nature of the tech industry, where giants like IBM adapt to market changes, while specialized firms like MicroStrategy maintain steady growth.
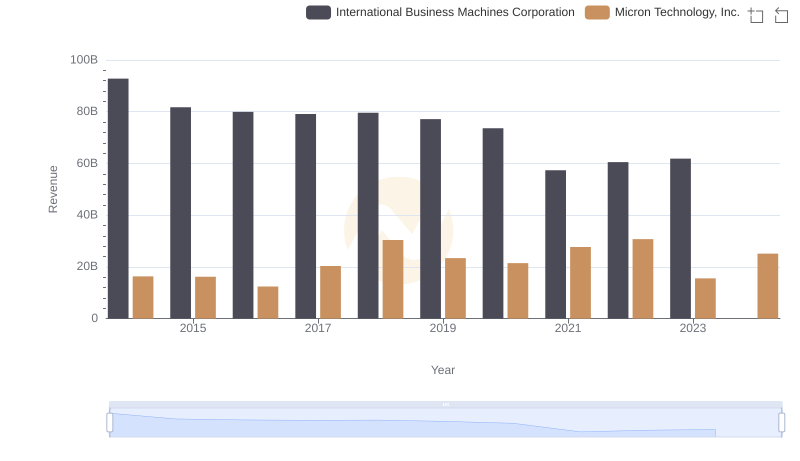
International Business Machines Corporation vs Micron Technology, Inc.: Examining Key Revenue Metrics
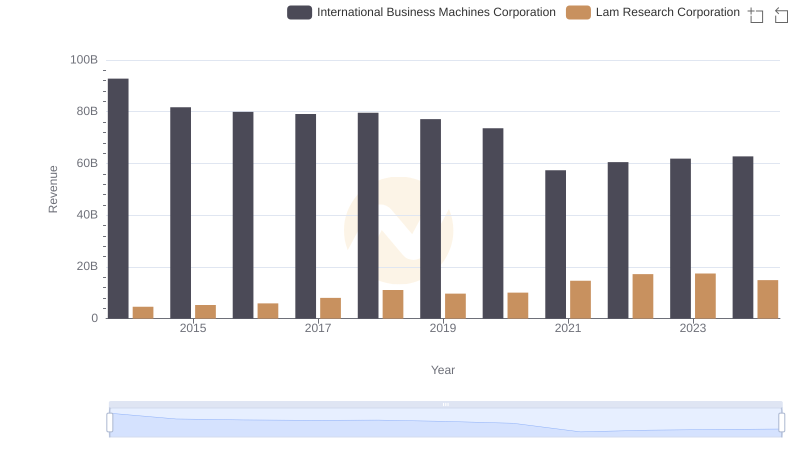
International Business Machines Corporation or Lam Research Corporation: Who Leads in Yearly Revenue?
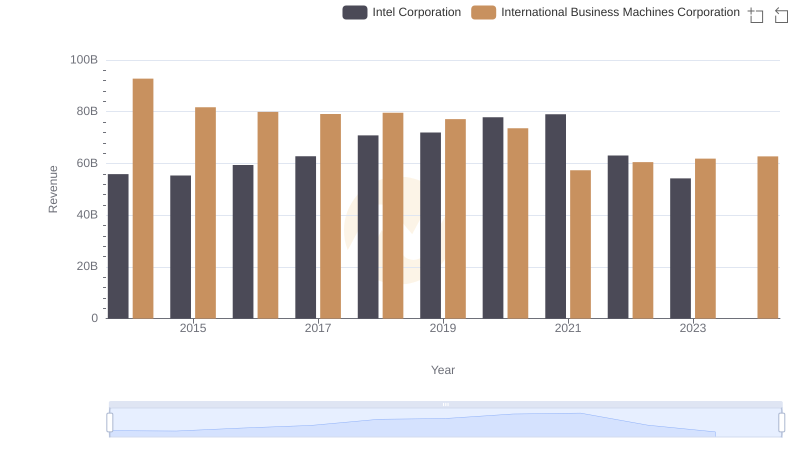
International Business Machines Corporation or Intel Corporation: Who Leads in Yearly Revenue?
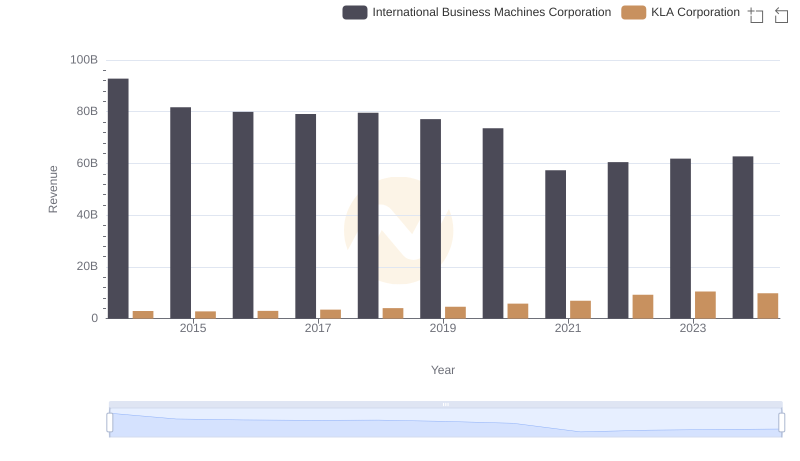
Breaking Down Revenue Trends: International Business Machines Corporation vs KLA Corporation
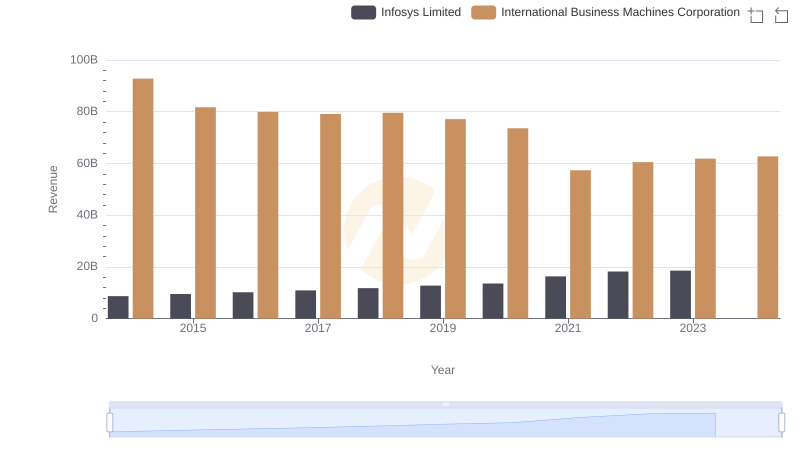
Revenue Insights: International Business Machines Corporation and Infosys Limited Performance Compared
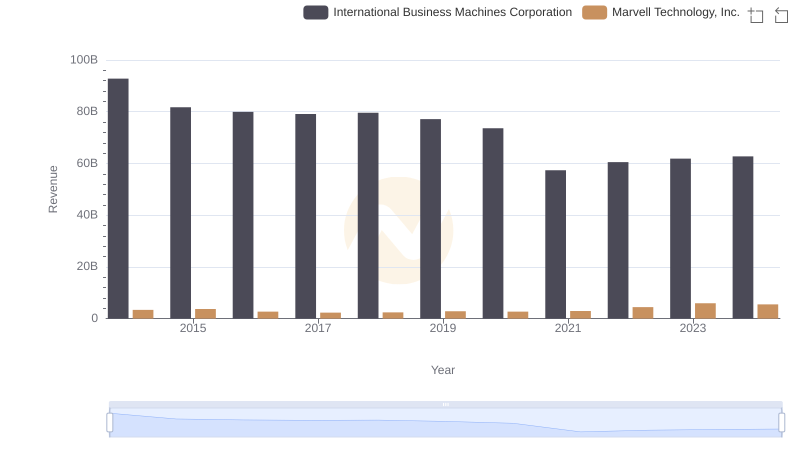
International Business Machines Corporation vs Marvell Technology, Inc.: Annual Revenue Growth Compared
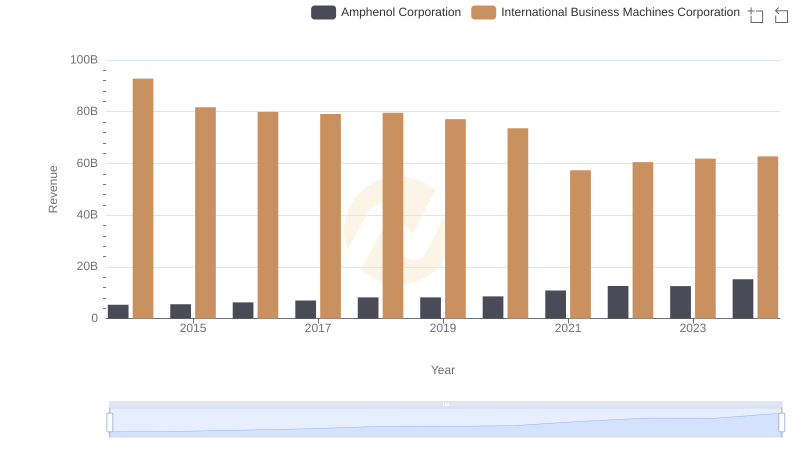
Revenue Insights: International Business Machines Corporation and Amphenol Corporation Performance Compared
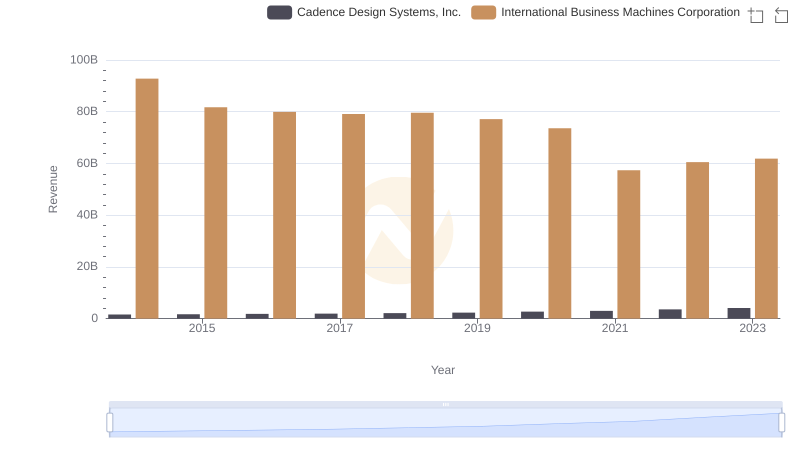
International Business Machines Corporation or Cadence Design Systems, Inc.: Who Leads in Yearly Revenue?
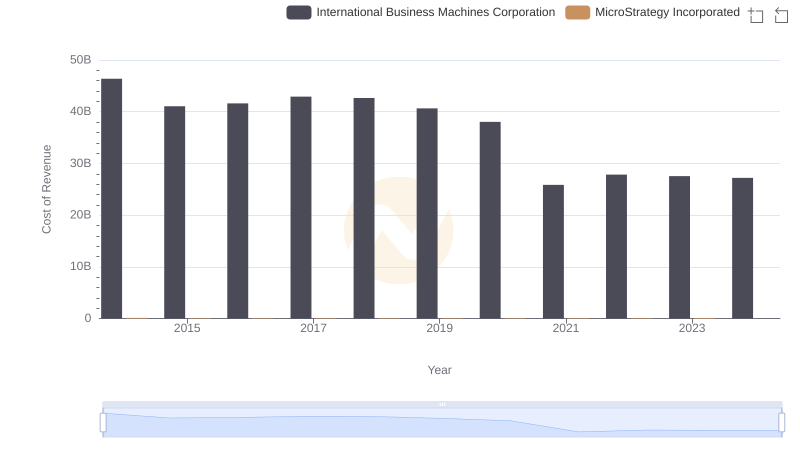
Cost of Revenue: Key Insights for International Business Machines Corporation and MicroStrategy Incorporated
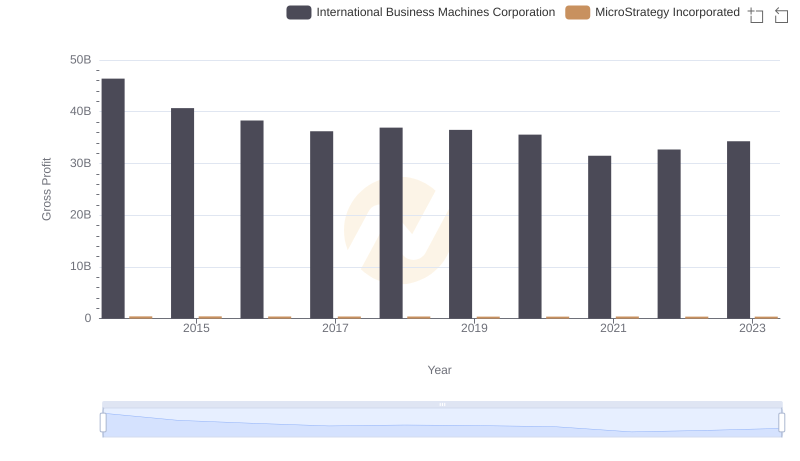
International Business Machines Corporation vs MicroStrategy Incorporated: A Gross Profit Performance Breakdown
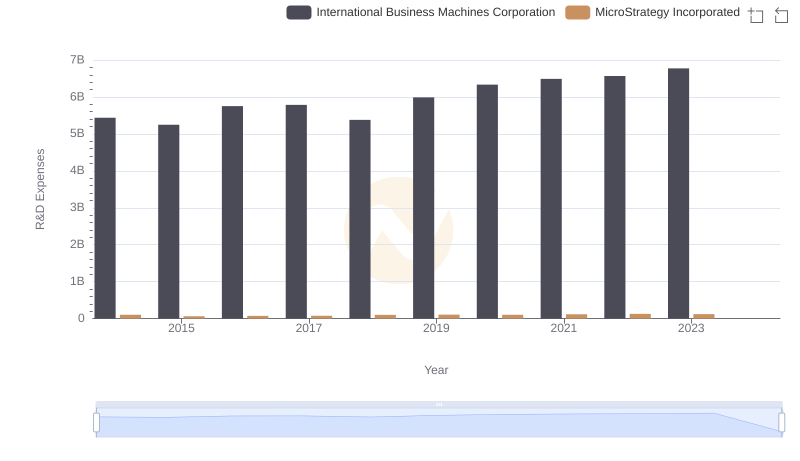
R&D Spending Showdown: International Business Machines Corporation vs MicroStrategy Incorporated
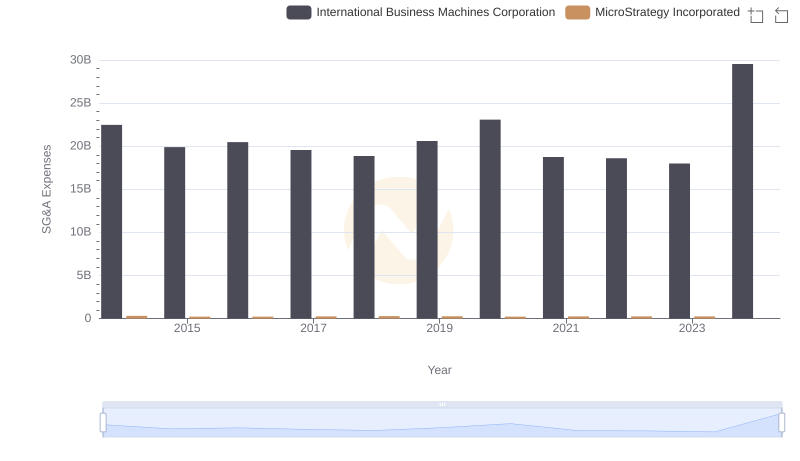
International Business Machines Corporation or MicroStrategy Incorporated: Who Manages SG&A Costs Better?