| __timestamp | International Business Machines Corporation | Lam Research Corporation |
|---|---|---|
| Wednesday, January 1, 2014 | 46407000000 | 2007481000 |
| Thursday, January 1, 2015 | 40684000000 | 2284336000 |
| Friday, January 1, 2016 | 38516000000 | 2618922000 |
| Sunday, January 1, 2017 | 36943000000 | 3603359000 |
| Monday, January 1, 2018 | 36936000000 | 5165032000 |
| Tuesday, January 1, 2019 | 31533000000 | 4358459000 |
| Wednesday, January 1, 2020 | 30865000000 | 4608693000 |
| Friday, January 1, 2021 | 31486000000 | 6805306000 |
| Saturday, January 1, 2022 | 32687000000 | 7871807000 |
| Sunday, January 1, 2023 | 34300000000 | 7776925000 |
| Monday, January 1, 2024 | 35551000000 | 7052791000 |
Unveiling the hidden dimensions of data
In the ever-evolving landscape of technology, the financial performance of industry giants like International Business Machines Corporation (IBM) and Lam Research Corporation offers valuable insights. From 2014 to 2023, IBM's gross profit has shown a downward trend, decreasing by approximately 26% from its peak in 2014. In contrast, Lam Research has experienced a remarkable growth trajectory, with its gross profit nearly quadrupling over the same period.
This divergence highlights the shifting dynamics within the tech industry. IBM, a stalwart in the sector, faces challenges in maintaining its historical profit levels, while Lam Research, a key player in semiconductor manufacturing, capitalizes on the growing demand for advanced chips. Notably, the data for 2024 is incomplete, indicating potential volatility or strategic shifts. This analysis underscores the importance of adaptability and innovation in sustaining financial success in the tech world.
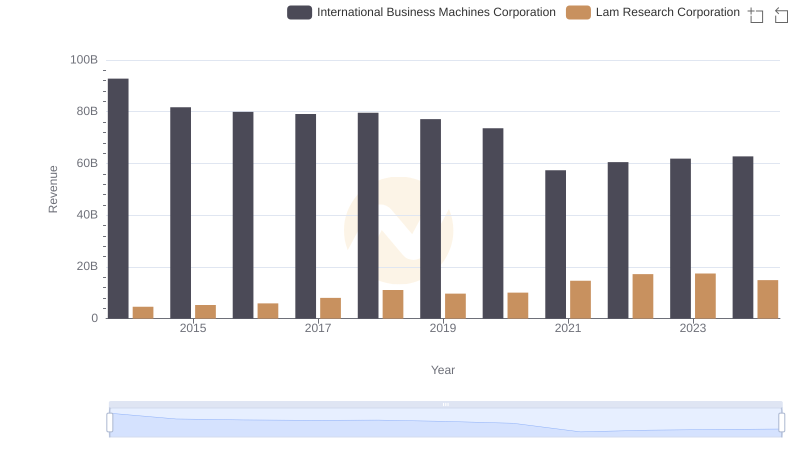
International Business Machines Corporation or Lam Research Corporation: Who Leads in Yearly Revenue?
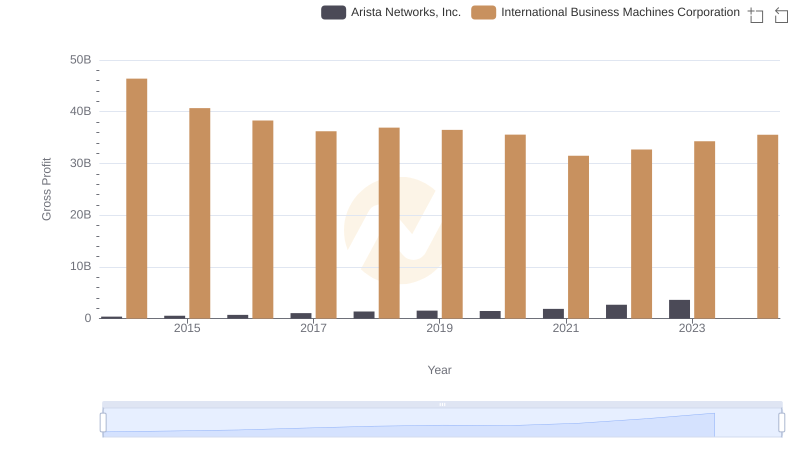
Who Generates Higher Gross Profit? International Business Machines Corporation or Arista Networks, Inc.
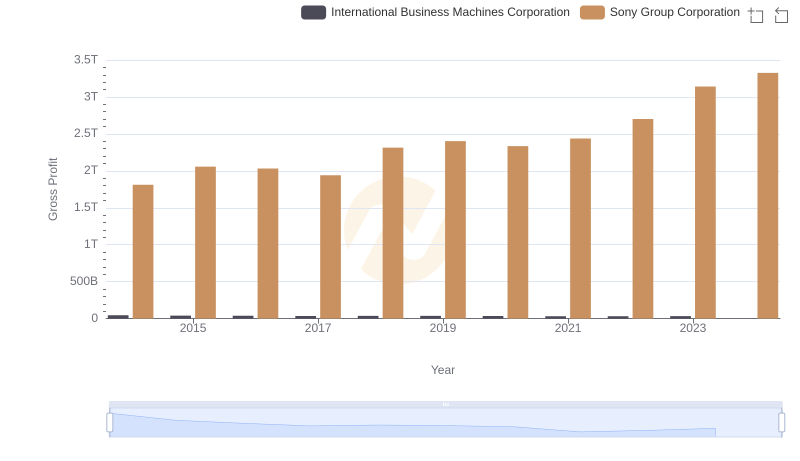
Who Generates Higher Gross Profit? International Business Machines Corporation or Sony Group Corporation
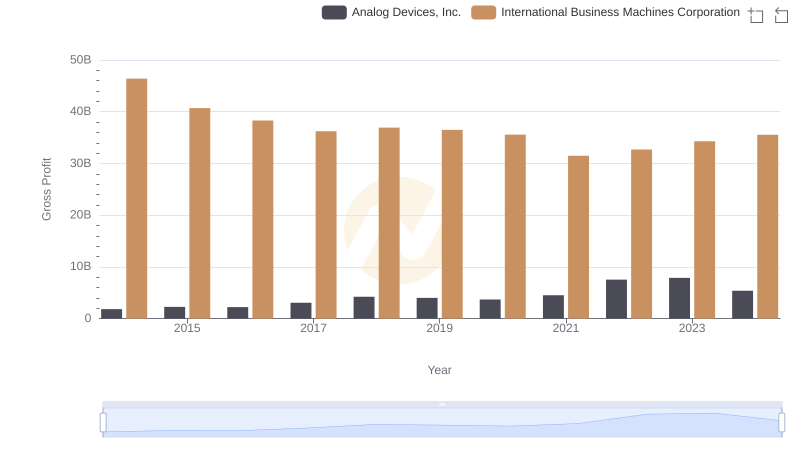
Who Generates Higher Gross Profit? International Business Machines Corporation or Analog Devices, Inc.
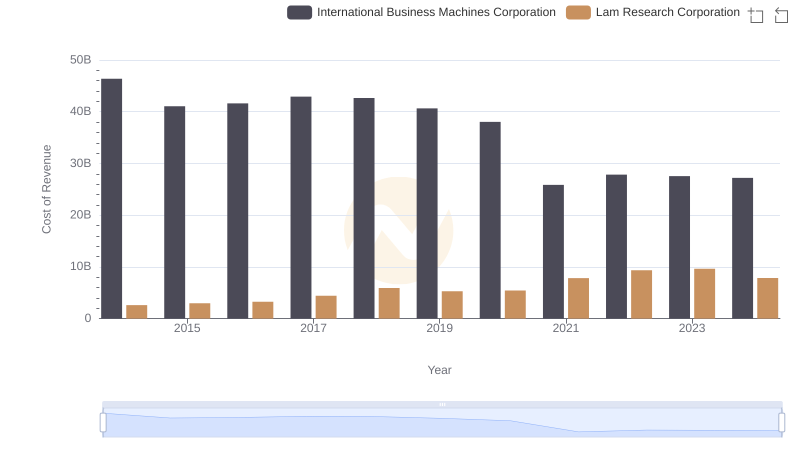
Analyzing Cost of Revenue: International Business Machines Corporation and Lam Research Corporation
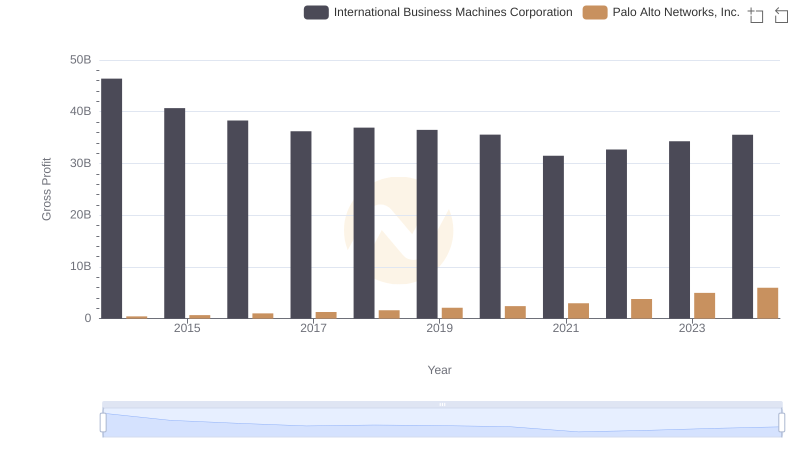
Gross Profit Trends Compared: International Business Machines Corporation vs Palo Alto Networks, Inc.
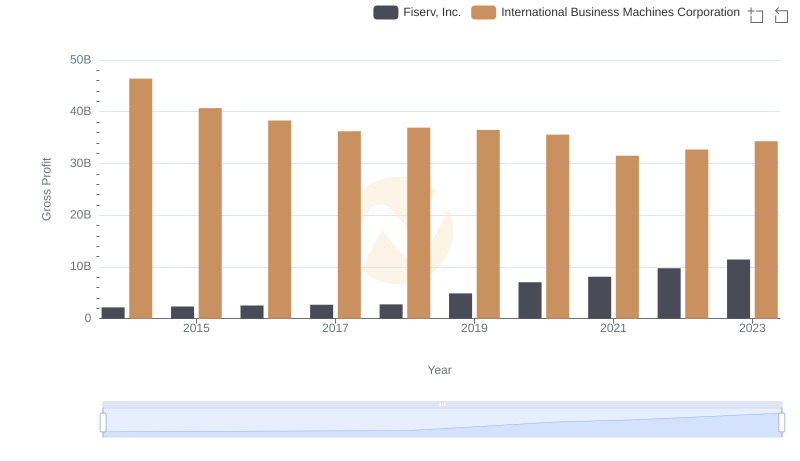
Key Insights on Gross Profit: International Business Machines Corporation vs Fiserv, Inc.
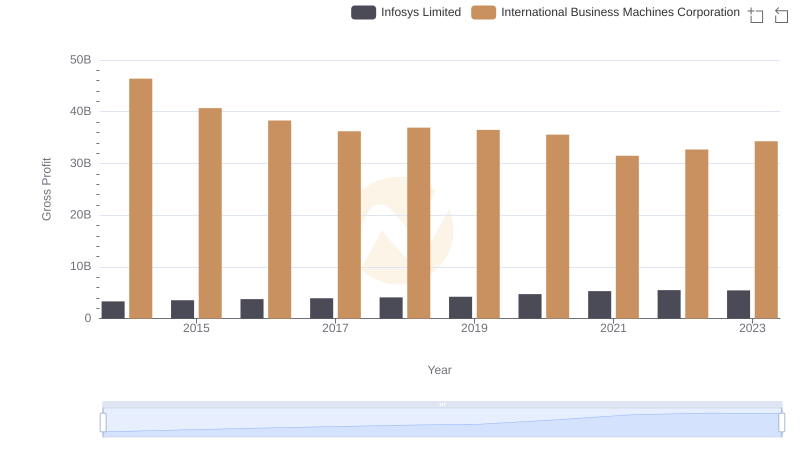
Key Insights on Gross Profit: International Business Machines Corporation vs Infosys Limited
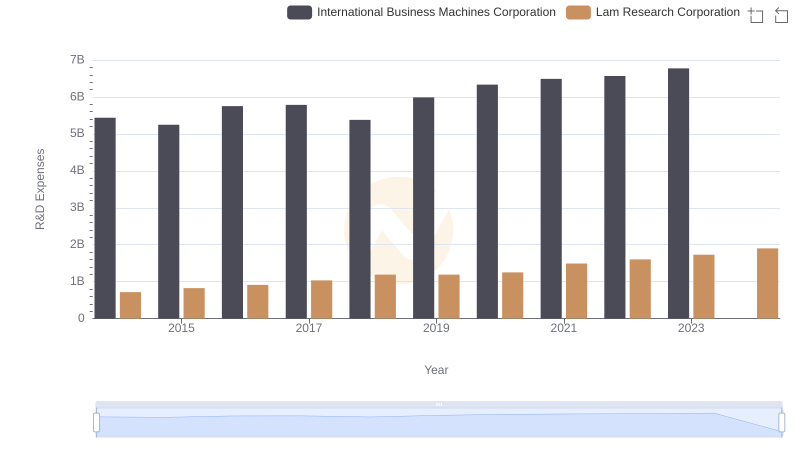
Research and Development Expenses Breakdown: International Business Machines Corporation vs Lam Research Corporation

Gross Profit Analysis: Comparing International Business Machines Corporation and Intel Corporation
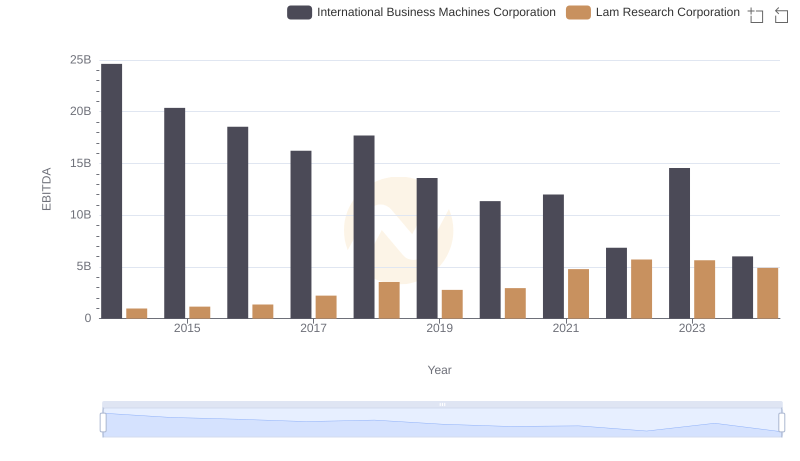
Professional EBITDA Benchmarking: International Business Machines Corporation vs Lam Research Corporation