| __timestamp | Gartner, Inc. | International Business Machines Corporation |
|---|---|---|
| Wednesday, January 1, 2014 | 876067000 | 22472000000 |
| Thursday, January 1, 2015 | 962677000 | 19894000000 |
| Friday, January 1, 2016 | 1089184000 | 20279000000 |
| Sunday, January 1, 2017 | 1599004000 | 19680000000 |
| Monday, January 1, 2018 | 1884141000 | 19366000000 |
| Tuesday, January 1, 2019 | 2103424000 | 18724000000 |
| Wednesday, January 1, 2020 | 2039087000 | 20561000000 |
| Friday, January 1, 2021 | 2155724000 | 18745000000 |
| Saturday, January 1, 2022 | 2480846000 | 17483000000 |
| Sunday, January 1, 2023 | 2701542000 | 17997000000 |
| Monday, January 1, 2024 | 2884814000 | 29536000000 |
Unlocking the unknown
In the ever-evolving landscape of corporate finance, the efficiency of Selling, General, and Administrative (SG&A) expenses is a critical metric for evaluating a company's operational prowess. Over the past decade, International Business Machines Corporation (IBM) and Gartner, Inc. have showcased contrasting trajectories in their SG&A expenditures.
From 2014 to 2023, IBM's SG&A expenses have seen a gradual decline, dropping from approximately $22.5 billion to $18 billion, reflecting a strategic shift towards leaner operations. This represents a reduction of nearly 20%, highlighting IBM's commitment to cost efficiency. In contrast, Gartner, Inc. has experienced a robust increase in SG&A expenses, surging by over 200% from $876 million in 2014 to $2.7 billion in 2023. This growth underscores Gartner's aggressive expansion and investment in its operational capabilities.
The data for 2024 remains incomplete, leaving room for speculation on future trends.
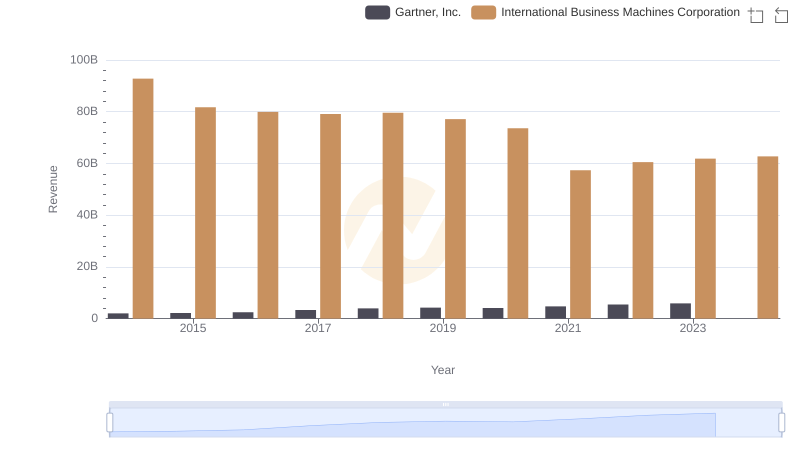
International Business Machines Corporation vs Gartner, Inc.: Examining Key Revenue Metrics
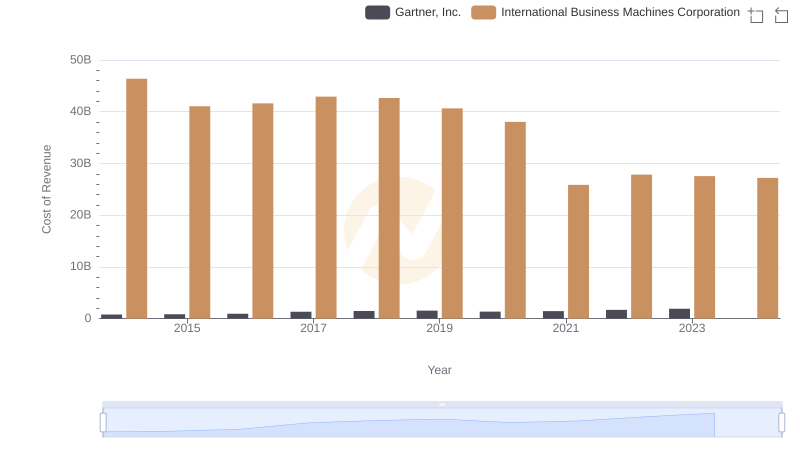
Cost Insights: Breaking Down International Business Machines Corporation and Gartner, Inc.'s Expenses
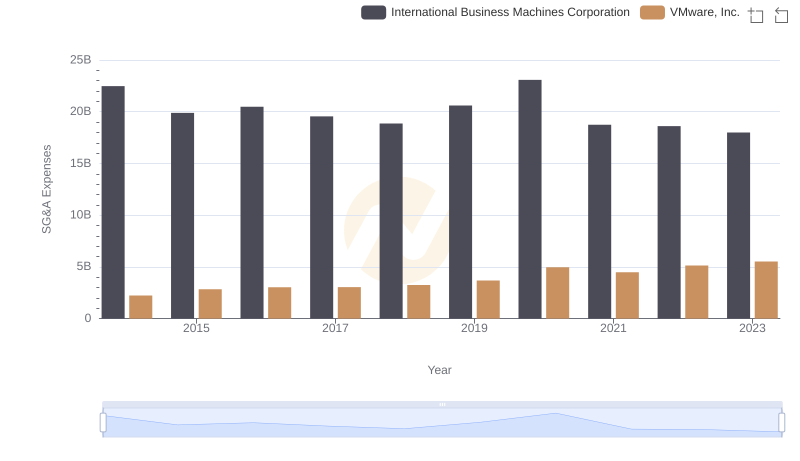
Breaking Down SG&A Expenses: International Business Machines Corporation vs VMware, Inc.
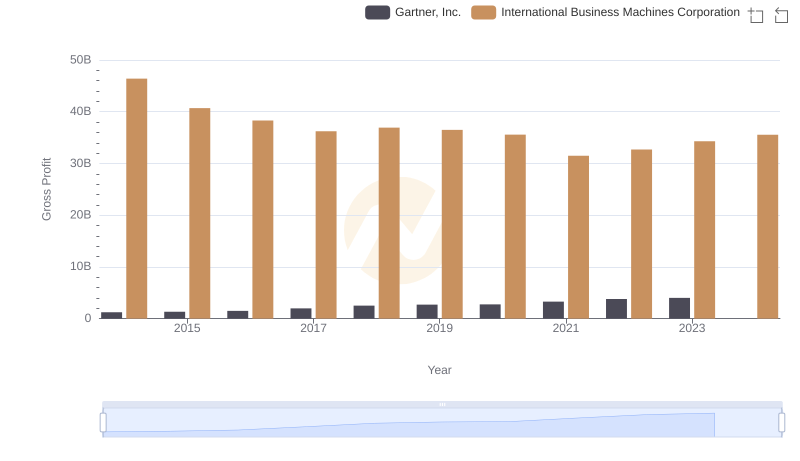
Who Generates Higher Gross Profit? International Business Machines Corporation or Gartner, Inc.
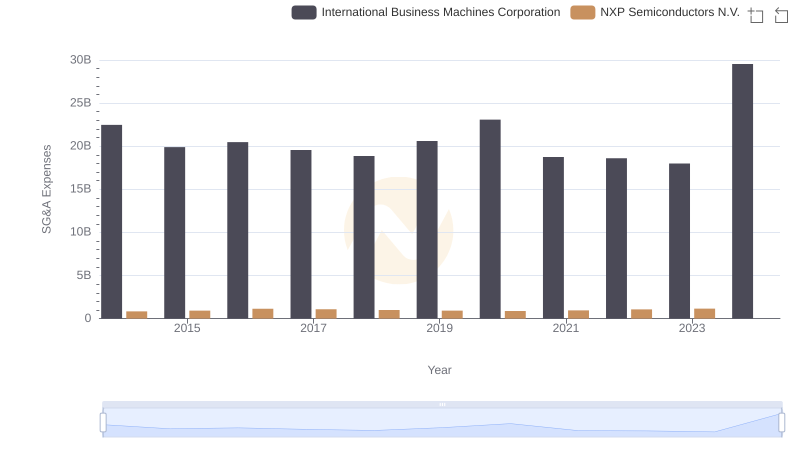
Selling, General, and Administrative Costs: International Business Machines Corporation vs NXP Semiconductors N.V.
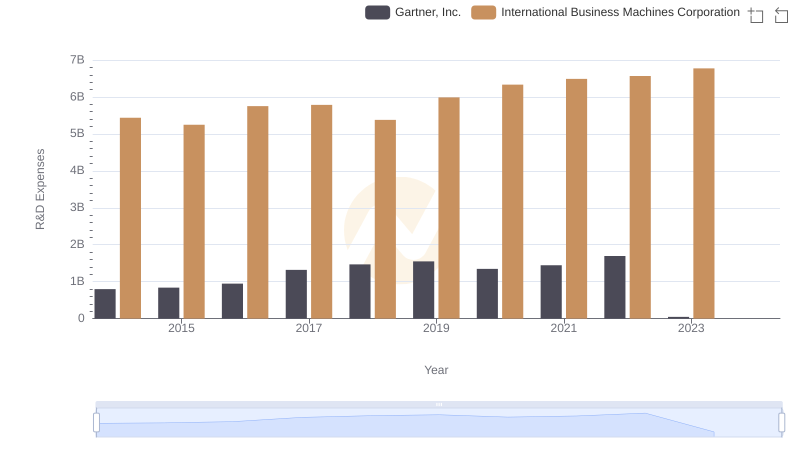
Research and Development Expenses Breakdown: International Business Machines Corporation vs Gartner, Inc.
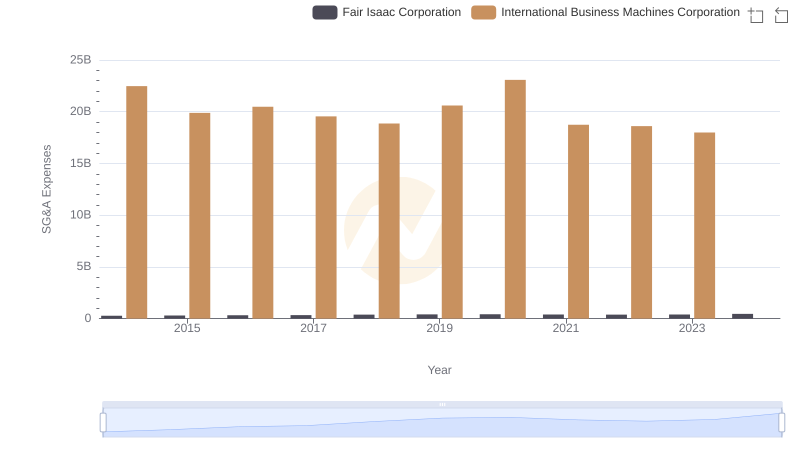
International Business Machines Corporation or Fair Isaac Corporation: Who Manages SG&A Costs Better?
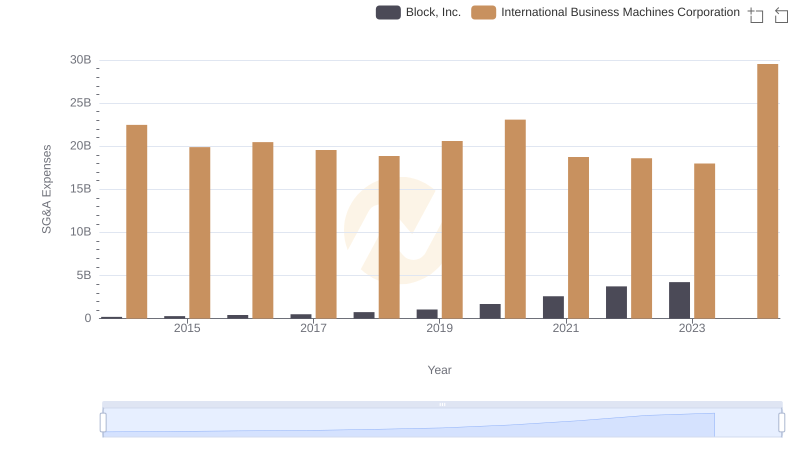
International Business Machines Corporation vs Block, Inc.: SG&A Expense Trends
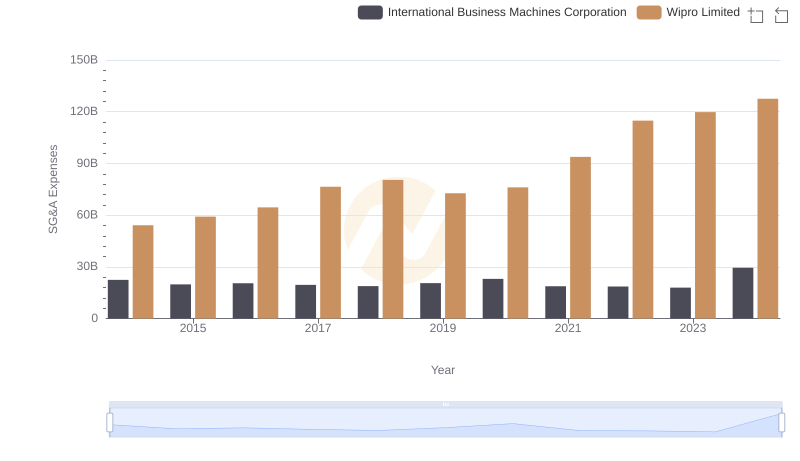
Selling, General, and Administrative Costs: International Business Machines Corporation vs Wipro Limited
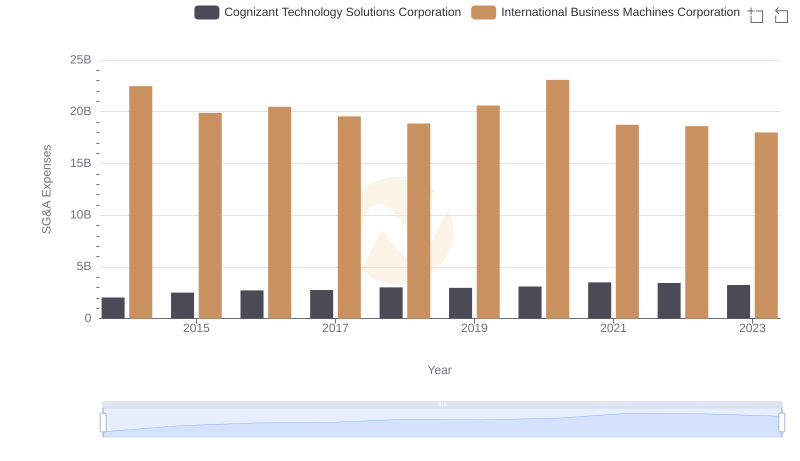
Who Optimizes SG&A Costs Better? International Business Machines Corporation or Cognizant Technology Solutions Corporation
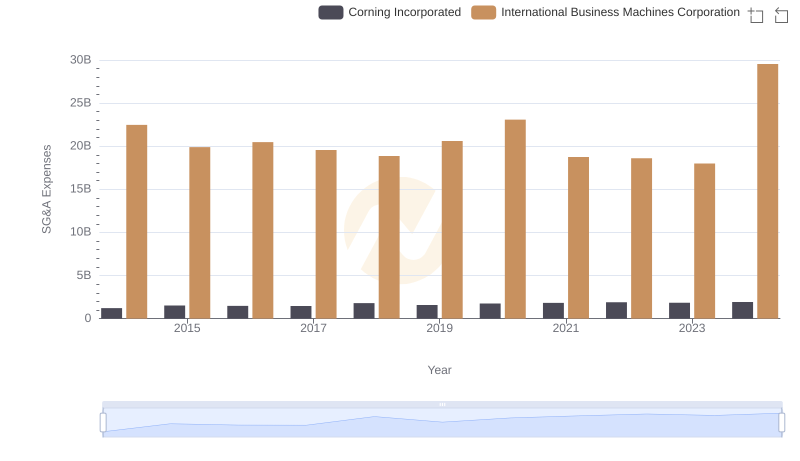
Selling, General, and Administrative Costs: International Business Machines Corporation vs Corning Incorporated

International Business Machines Corporation vs Gartner, Inc.: In-Depth EBITDA Performance Comparison