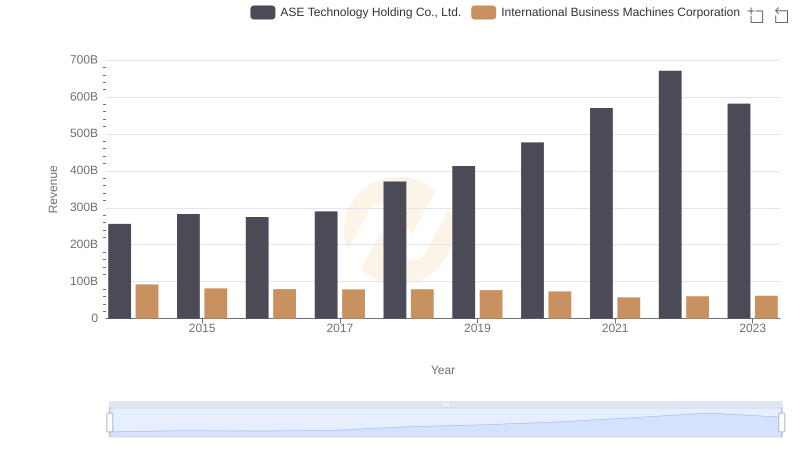
| __timestamp | ASE Technology Holding Co., Ltd. | International Business Machines Corporation |
|---|---|---|
| Wednesday, January 1, 2014 | 203051000000 | 46386000000 |
| Thursday, January 1, 2015 | 233153000000 | 41057000000 |
| Friday, January 1, 2016 | 221690000000 | 41403000000 |
| Sunday, January 1, 2017 | 237709000000 | 42196000000 |
| Monday, January 1, 2018 | 309929000000 | 42655000000 |
| Tuesday, January 1, 2019 | 348871000000 | 26181000000 |
| Wednesday, January 1, 2020 | 398994000000 | 24314000000 |
| Friday, January 1, 2021 | 459628000000 | 25865000000 |
| Saturday, January 1, 2022 | 535943000000 | 27842000000 |
| Sunday, January 1, 2023 | 490157339000 | 27560000000 |
| Monday, January 1, 2024 | 499722880000 | 27202000000 |
Unleashing the power of data
In the ever-evolving landscape of global technology, cost efficiency remains a pivotal factor for success. This analysis delves into the cost of revenue trends for International Business Machines Corporation (IBM) and ASE Technology Holding Co., Ltd. over the past decade. From 2014 to 2023, ASE Technology's cost of revenue surged by approximately 141%, reflecting its aggressive expansion and scaling strategies. In contrast, IBM's cost of revenue decreased by about 41%, showcasing its strategic shift towards more efficient operations and services.
The data reveals a stark contrast in financial strategies: while ASE Technology's costs peaked in 2022, IBM consistently reduced its expenses, reaching its lowest in 2023. This divergence highlights the different paths these tech giants are taking in the competitive market. Missing data for ASE Technology in 2024 suggests a potential shift or reevaluation in their financial reporting. Stay tuned as these industry leaders continue to redefine efficiency.

International Business Machines Corporation vs Seagate Technology Holdings plc: Efficiency in Cost of Revenue Explored
Comparing Revenue Performance: International Business Machines Corporation or ASE Technology Holding Co., Ltd.?
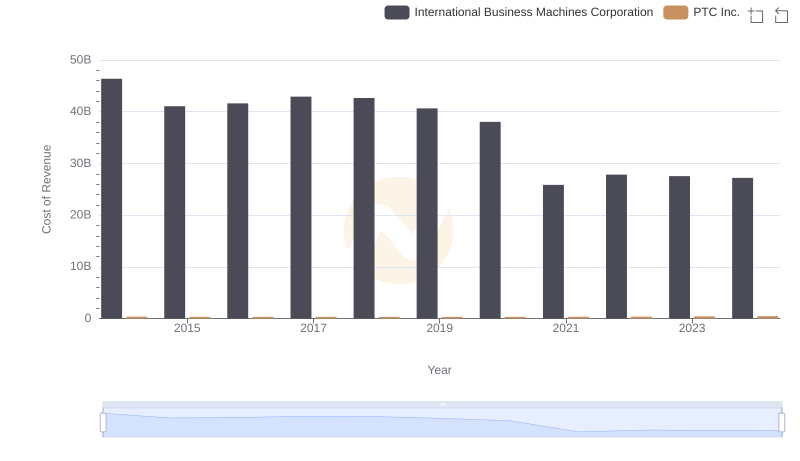
Cost Insights: Breaking Down International Business Machines Corporation and PTC Inc.'s Expenses
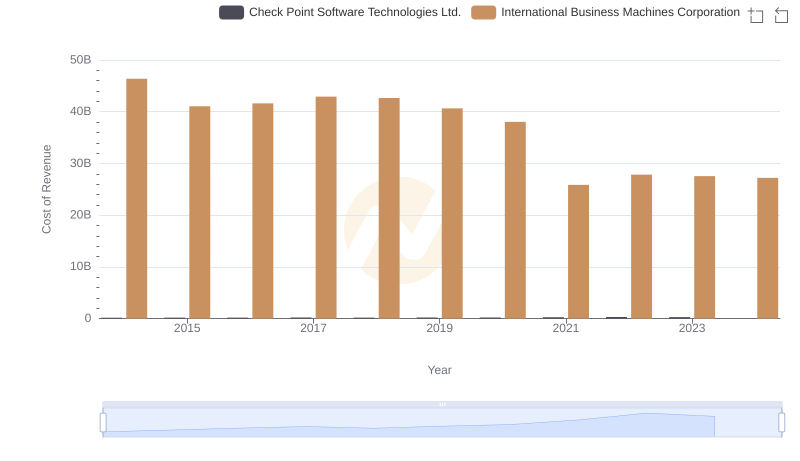
Cost of Revenue: Key Insights for International Business Machines Corporation and Check Point Software Technologies Ltd.

Cost Insights: Breaking Down International Business Machines Corporation and Pure Storage, Inc.'s Expenses
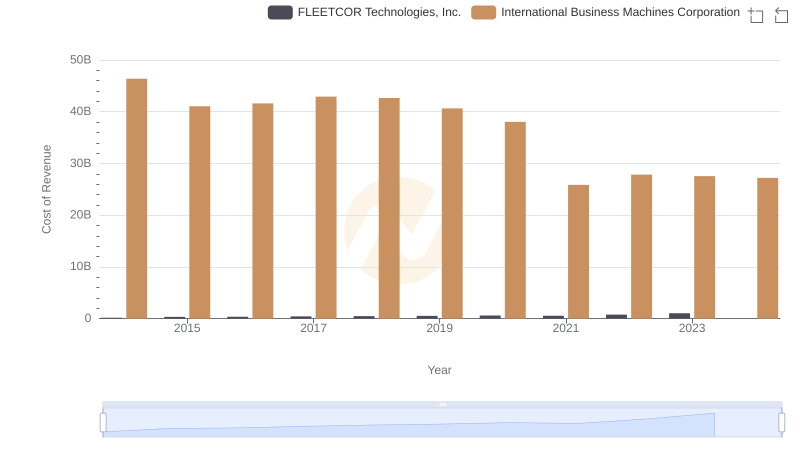
Analyzing Cost of Revenue: International Business Machines Corporation and FLEETCOR Technologies, Inc.
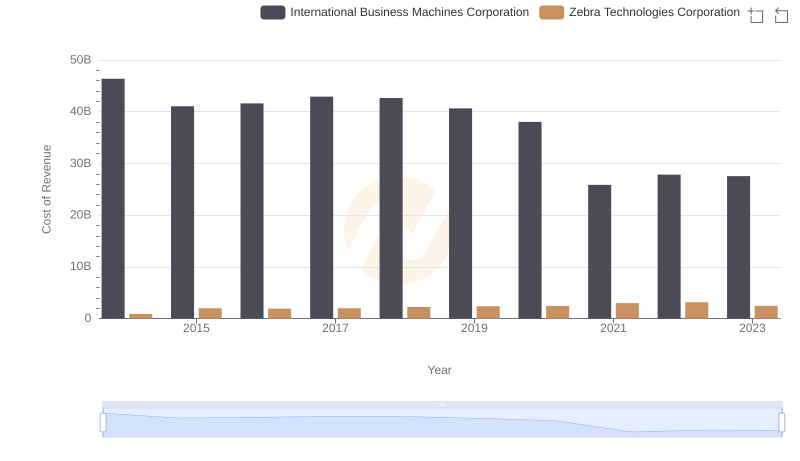
Cost of Revenue Trends: International Business Machines Corporation vs Zebra Technologies Corporation
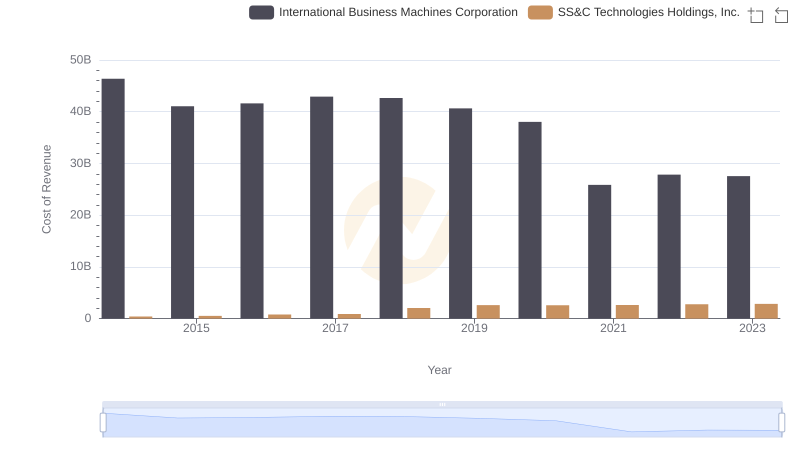
Analyzing Cost of Revenue: International Business Machines Corporation and SS&C Technologies Holdings, Inc.
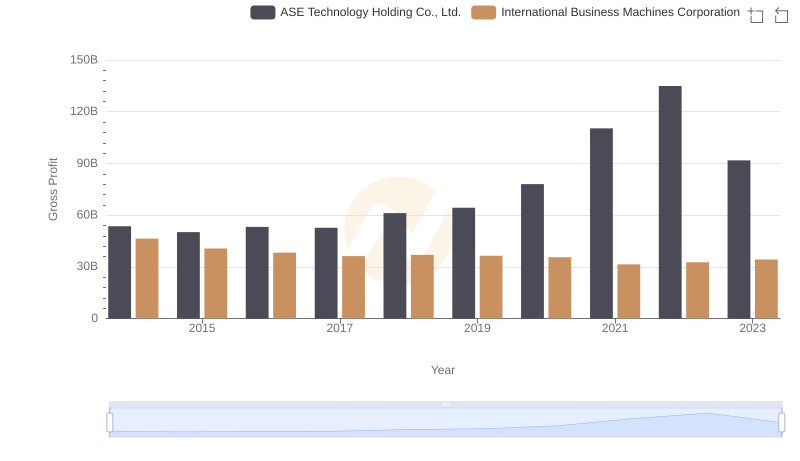
International Business Machines Corporation vs ASE Technology Holding Co., Ltd.: A Gross Profit Performance Breakdown
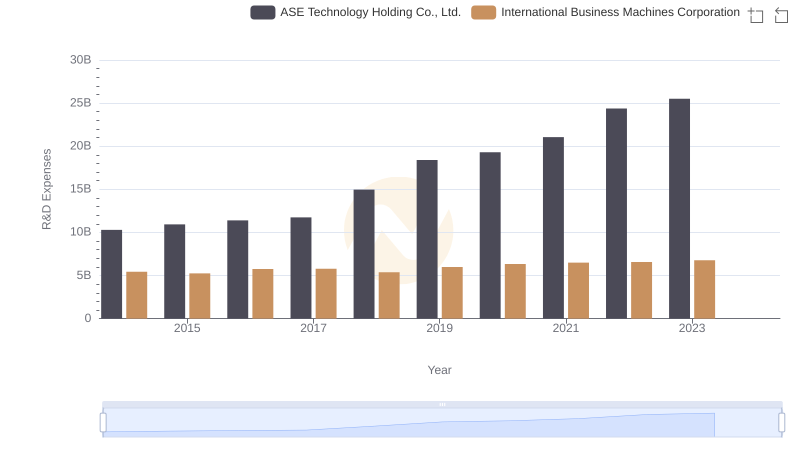
Who Prioritizes Innovation? R&D Spending Compared for International Business Machines Corporation and ASE Technology Holding Co., Ltd.
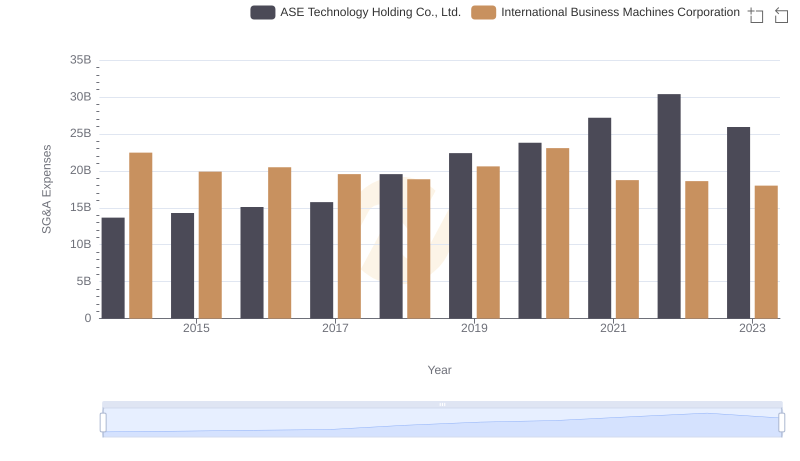
Comparing SG&A Expenses: International Business Machines Corporation vs ASE Technology Holding Co., Ltd. Trends and Insights
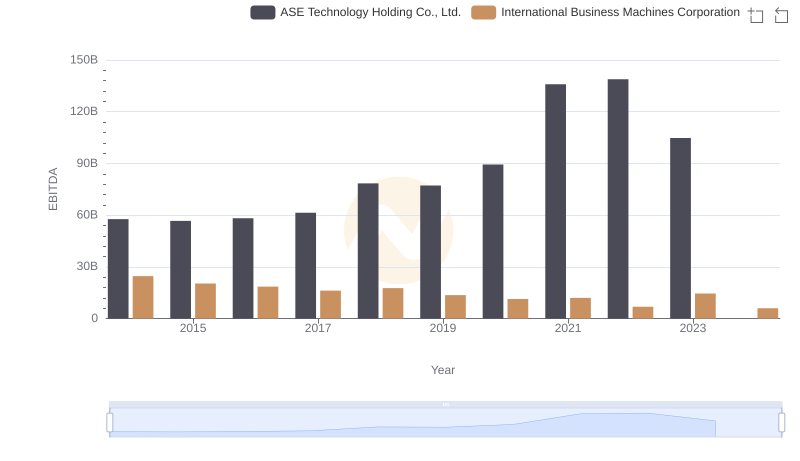
EBITDA Performance Review: International Business Machines Corporation vs ASE Technology Holding Co., Ltd.