| __timestamp | ASE Technology Holding Co., Ltd. | International Business Machines Corporation |
|---|---|---|
| Wednesday, January 1, 2014 | 13673000000 | 22472000000 |
| Thursday, January 1, 2015 | 14295000000 | 19894000000 |
| Friday, January 1, 2016 | 15099000000 | 20279000000 |
| Sunday, January 1, 2017 | 15767000000 | 19680000000 |
| Monday, January 1, 2018 | 19552000000 | 19366000000 |
| Tuesday, January 1, 2019 | 22389000000 | 18724000000 |
| Wednesday, January 1, 2020 | 23806000000 | 20561000000 |
| Friday, January 1, 2021 | 27191000000 | 18745000000 |
| Saturday, January 1, 2022 | 30384000000 | 17483000000 |
| Sunday, January 1, 2023 | 25930017000 | 17997000000 |
| Monday, January 1, 2024 | 27353513000 | 29536000000 |
In pursuit of knowledge
In the ever-evolving landscape of global technology, the Selling, General, and Administrative (SG&A) expenses of industry titans like International Business Machines Corporation (IBM) and ASE Technology Holding Co., Ltd. offer a fascinating glimpse into their operational strategies. From 2014 to 2023, IBM's SG&A expenses have shown a steady decline, dropping from approximately $22.5 billion to $18 billion, reflecting a strategic shift towards efficiency and cost management. In contrast, ASE Technology's expenses surged by over 90%, peaking at $30.4 billion in 2022, before slightly retracting in 2023. This divergence highlights IBM's focus on streamlining operations, while ASE Technology's growth trajectory underscores its aggressive expansion and market penetration strategies. The data for 2024 is incomplete, leaving room for speculation on future trends. As these companies navigate the complexities of the tech world, their financial strategies remain pivotal to their success.
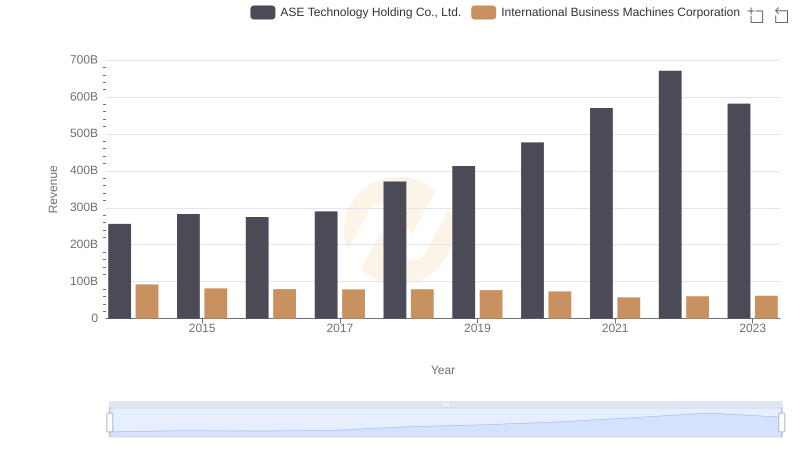
Comparing Revenue Performance: International Business Machines Corporation or ASE Technology Holding Co., Ltd.?
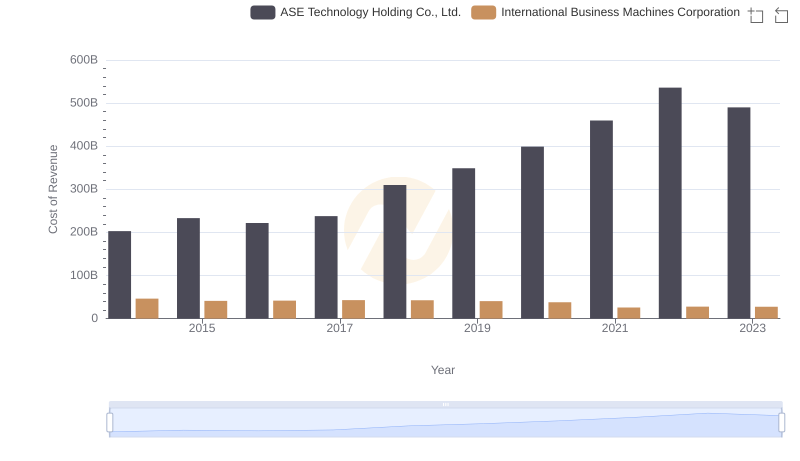
International Business Machines Corporation vs ASE Technology Holding Co., Ltd.: Efficiency in Cost of Revenue Explored
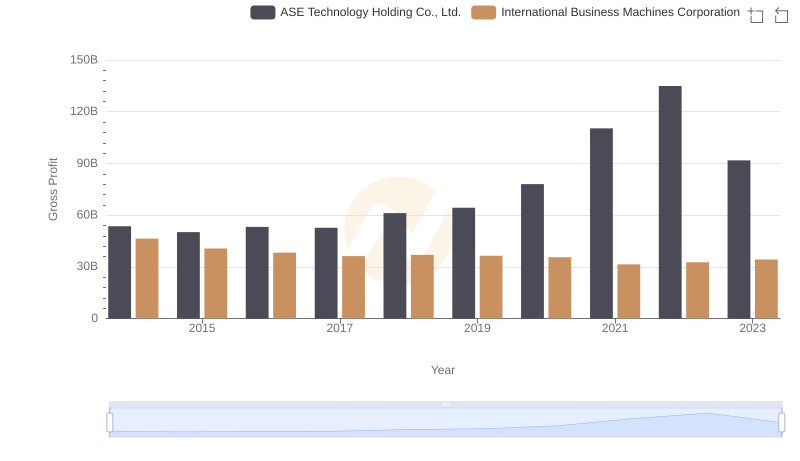
International Business Machines Corporation vs ASE Technology Holding Co., Ltd.: A Gross Profit Performance Breakdown
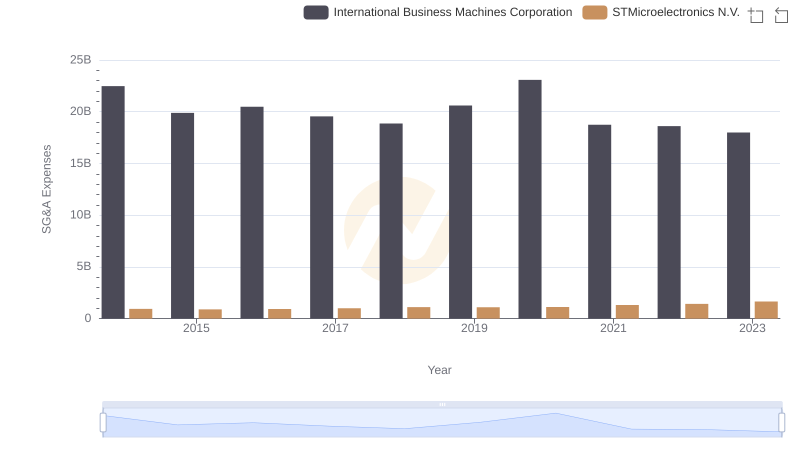
International Business Machines Corporation or STMicroelectronics N.V.: Who Manages SG&A Costs Better?
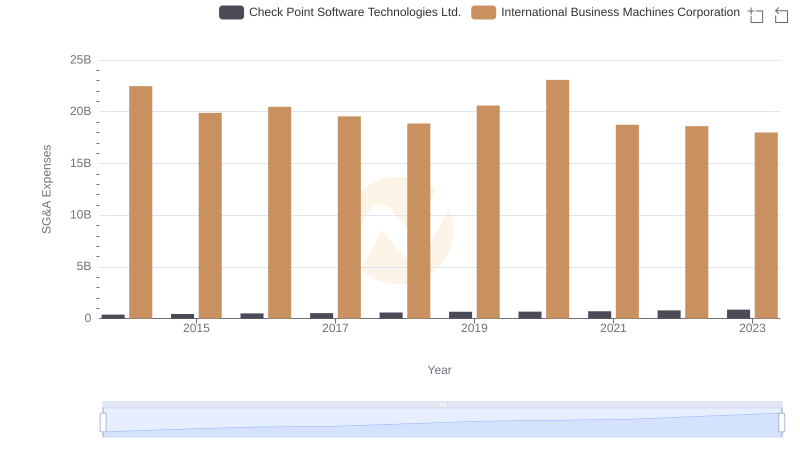
Operational Costs Compared: SG&A Analysis of International Business Machines Corporation and Check Point Software Technologies Ltd.
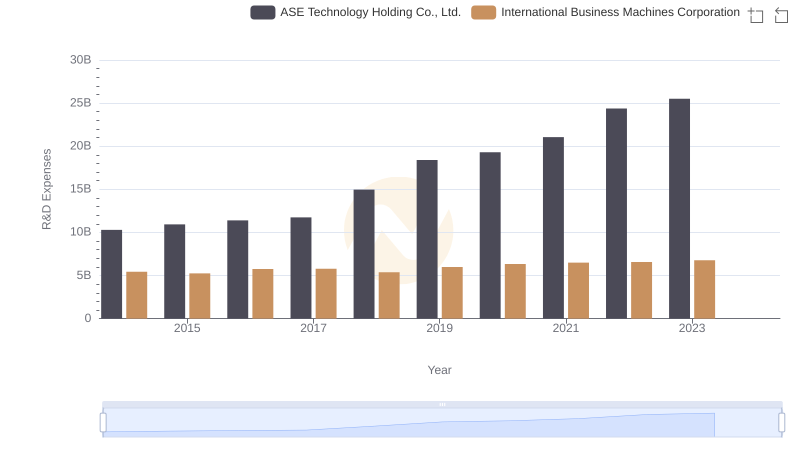
Who Prioritizes Innovation? R&D Spending Compared for International Business Machines Corporation and ASE Technology Holding Co., Ltd.
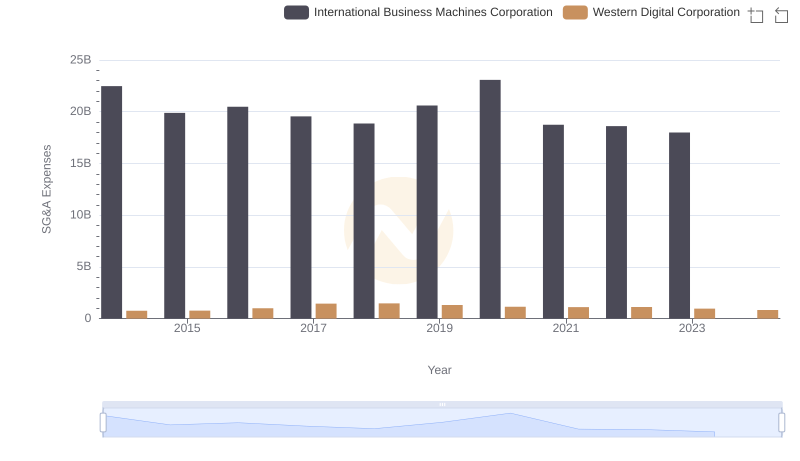
Selling, General, and Administrative Costs: International Business Machines Corporation vs Western Digital Corporation
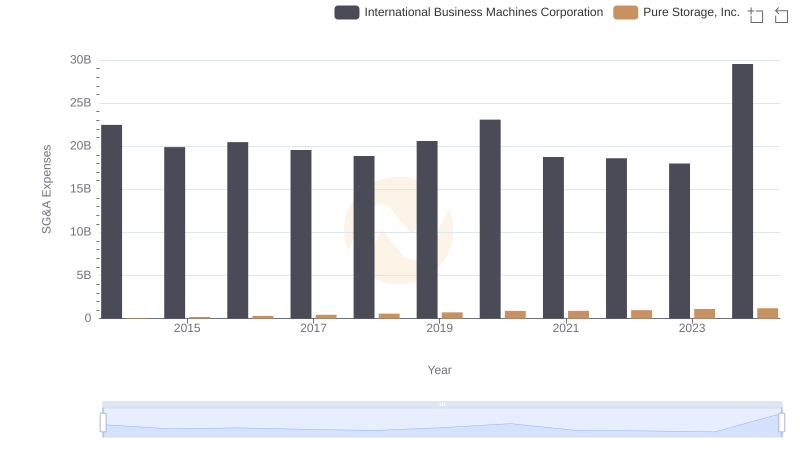
International Business Machines Corporation or Pure Storage, Inc.: Who Manages SG&A Costs Better?
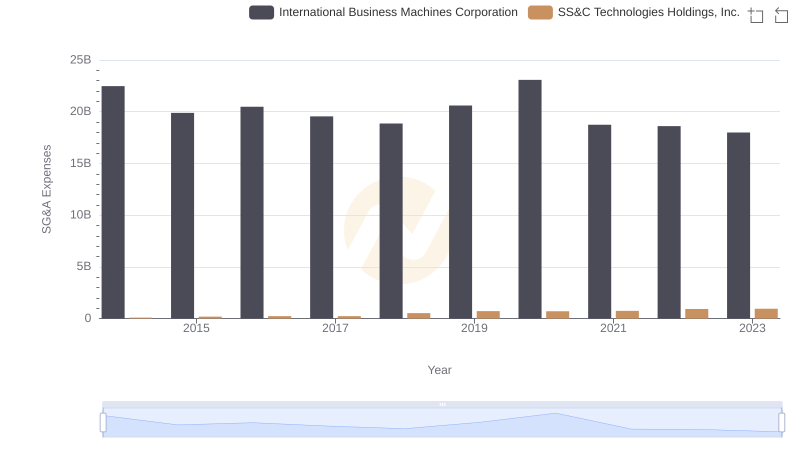
SG&A Efficiency Analysis: Comparing International Business Machines Corporation and SS&C Technologies Holdings, Inc.
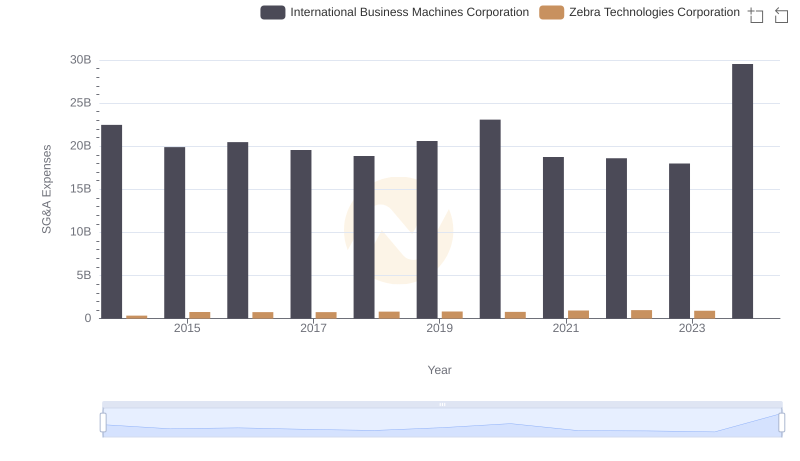
Who Optimizes SG&A Costs Better? International Business Machines Corporation or Zebra Technologies Corporation
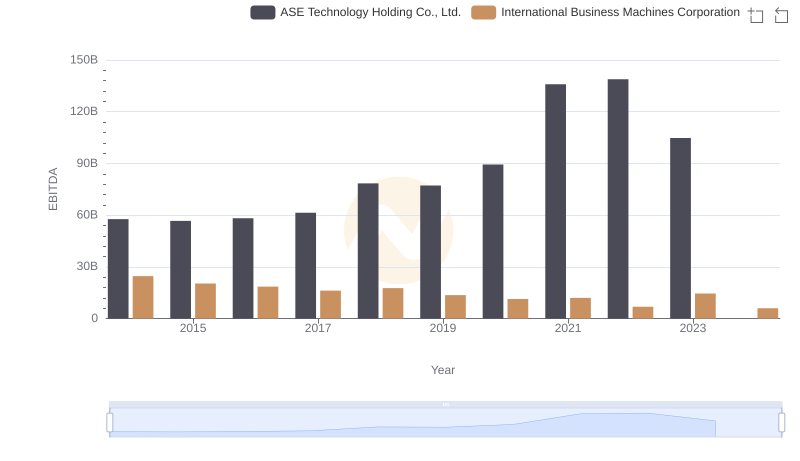
EBITDA Performance Review: International Business Machines Corporation vs ASE Technology Holding Co., Ltd.
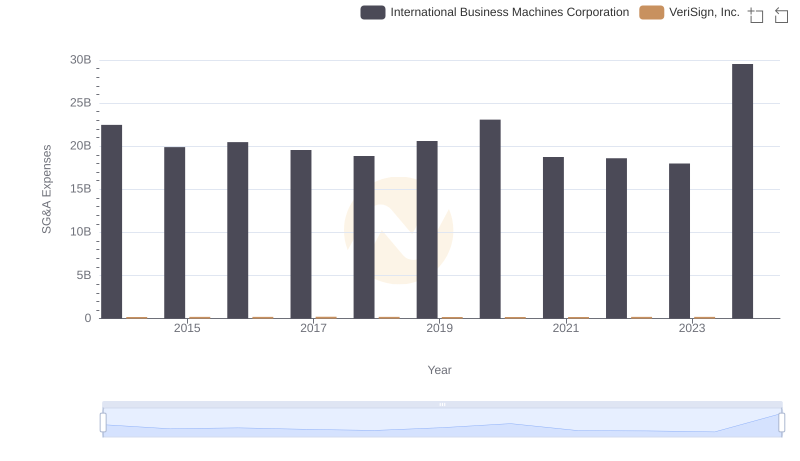
SG&A Efficiency Analysis: Comparing International Business Machines Corporation and VeriSign, Inc.