| __timestamp | ASE Technology Holding Co., Ltd. | International Business Machines Corporation |
|---|---|---|
| Wednesday, January 1, 2014 | 57728376000 | 24962000000 |
| Thursday, January 1, 2015 | 56716330000 | 20268000000 |
| Friday, January 1, 2016 | 58196307000 | 17341000000 |
| Sunday, January 1, 2017 | 61377328000 | 16556000000 |
| Monday, January 1, 2018 | 78432873000 | 16545000000 |
| Tuesday, January 1, 2019 | 77173662000 | 14609000000 |
| Wednesday, January 1, 2020 | 89377502000 | 10555000000 |
| Friday, January 1, 2021 | 135966088000 | 12409000000 |
| Saturday, January 1, 2022 | 138852591000 | 7174000000 |
| Sunday, January 1, 2023 | 104757657000 | 14693000000 |
| Monday, January 1, 2024 | 104735170000 | 6015000000 |
Unlocking the unknown
In the ever-evolving landscape of global technology, the financial performance of industry giants like International Business Machines Corporation (IBM) and ASE Technology Holding Co., Ltd. offers valuable insights. Over the past decade, ASE Technology has consistently outperformed IBM in terms of EBITDA, showcasing a robust growth trajectory. From 2014 to 2023, ASE Technology's EBITDA surged by approximately 81%, peaking in 2022, while IBM experienced a decline of around 41% during the same period.
The data reveals a significant shift in 2020, where ASE Technology's EBITDA nearly doubled compared to IBM's, highlighting its resilience and strategic prowess in the semiconductor industry. Meanwhile, IBM's EBITDA saw a notable dip in 2022, reflecting challenges in its business model. As we look to the future, the missing data for 2024 suggests a period of uncertainty, inviting speculation on how these tech titans will navigate the evolving market dynamics.
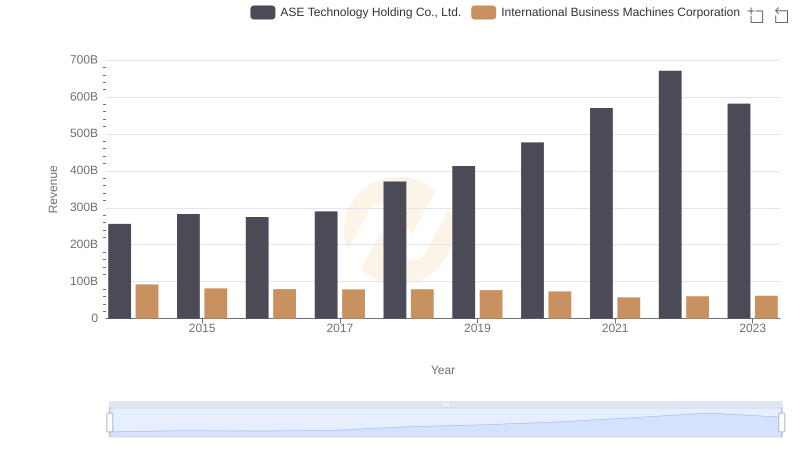
Comparing Revenue Performance: International Business Machines Corporation or ASE Technology Holding Co., Ltd.?
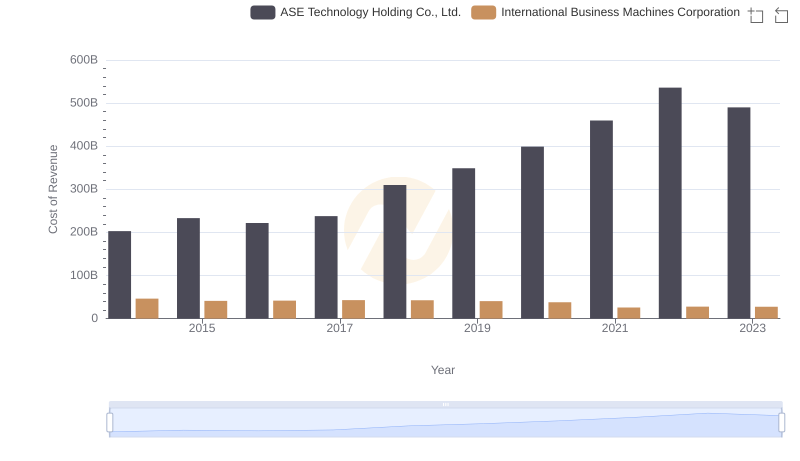
International Business Machines Corporation vs ASE Technology Holding Co., Ltd.: Efficiency in Cost of Revenue Explored
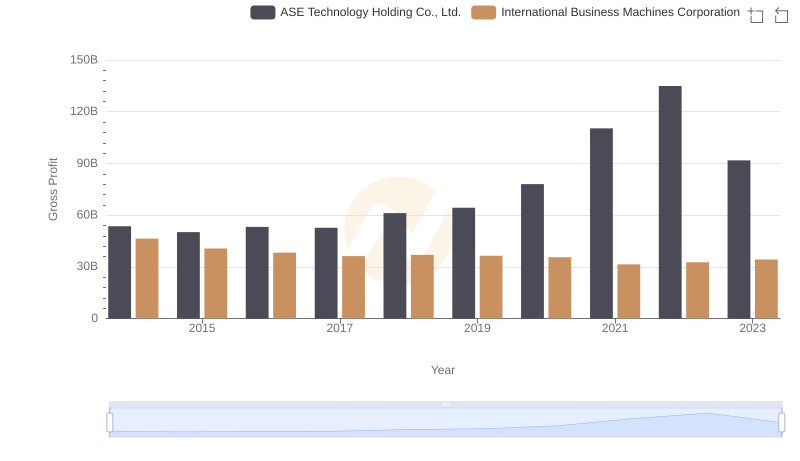
International Business Machines Corporation vs ASE Technology Holding Co., Ltd.: A Gross Profit Performance Breakdown
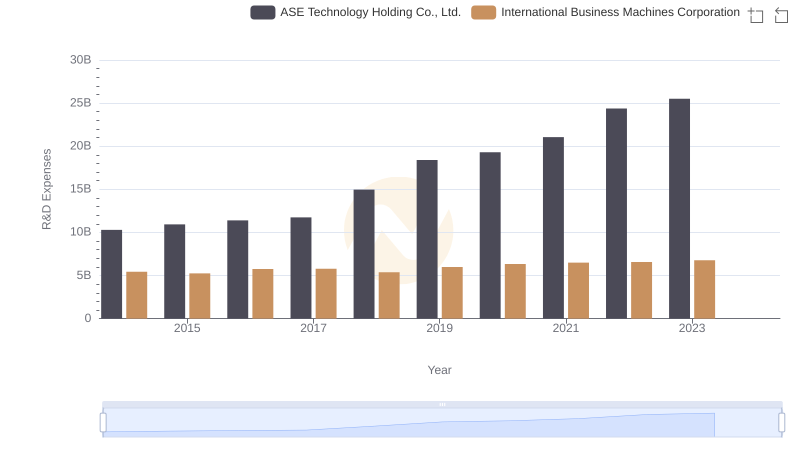
Who Prioritizes Innovation? R&D Spending Compared for International Business Machines Corporation and ASE Technology Holding Co., Ltd.
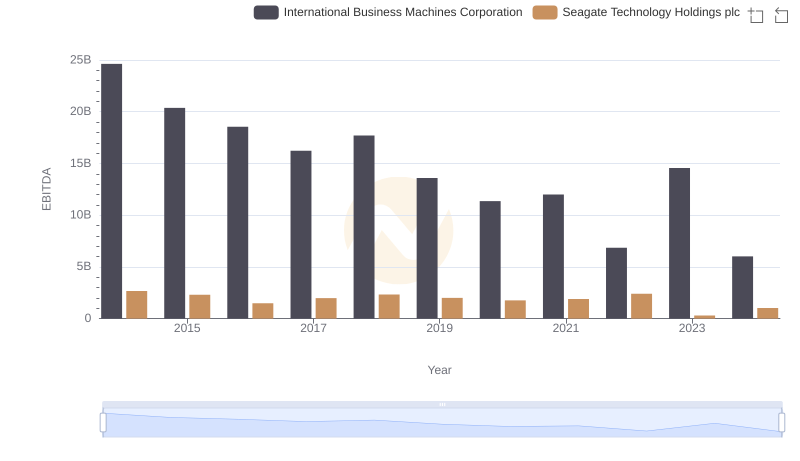
International Business Machines Corporation vs Seagate Technology Holdings plc: In-Depth EBITDA Performance Comparison

International Business Machines Corporation vs FLEETCOR Technologies, Inc.: In-Depth EBITDA Performance Comparison
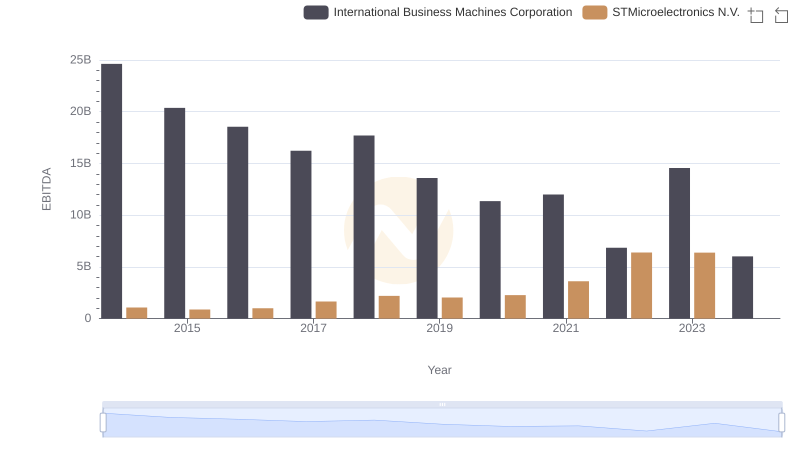
Professional EBITDA Benchmarking: International Business Machines Corporation vs STMicroelectronics N.V.
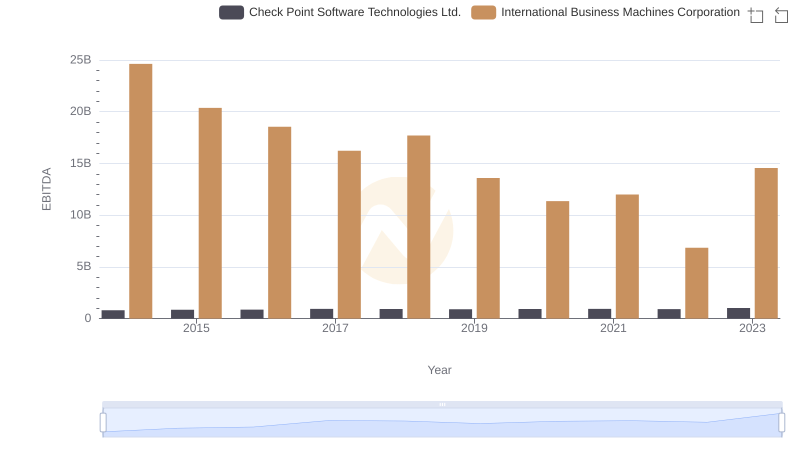
International Business Machines Corporation and Check Point Software Technologies Ltd.: A Detailed Examination of EBITDA Performance
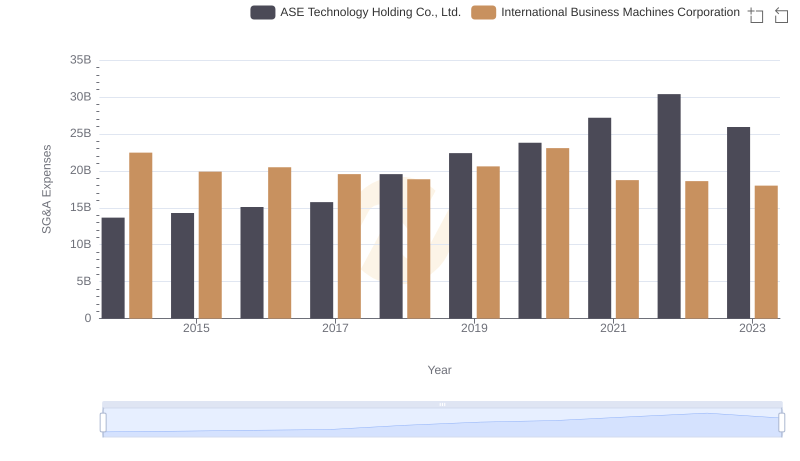
Comparing SG&A Expenses: International Business Machines Corporation vs ASE Technology Holding Co., Ltd. Trends and Insights
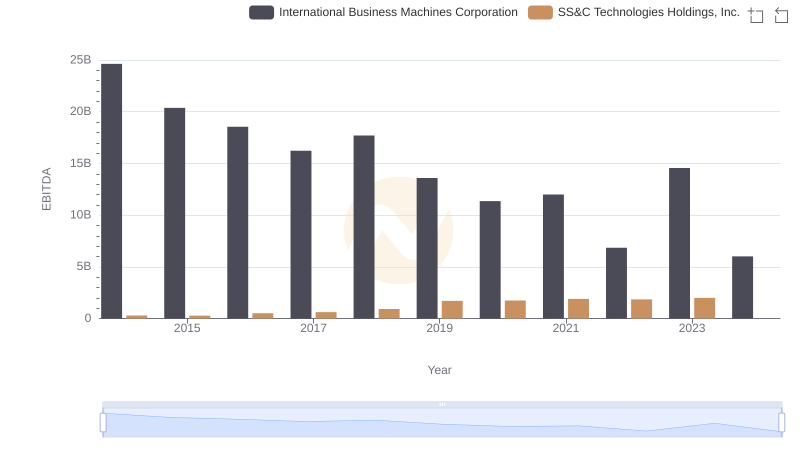
Comprehensive EBITDA Comparison: International Business Machines Corporation vs SS&C Technologies Holdings, Inc.
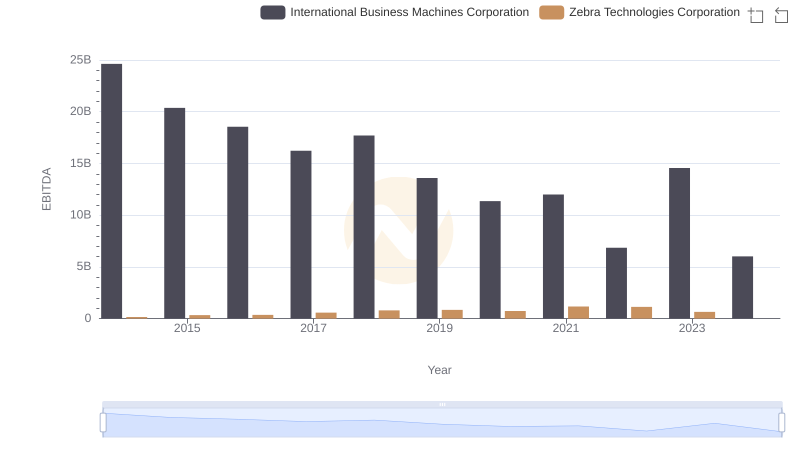
A Side-by-Side Analysis of EBITDA: International Business Machines Corporation and Zebra Technologies Corporation
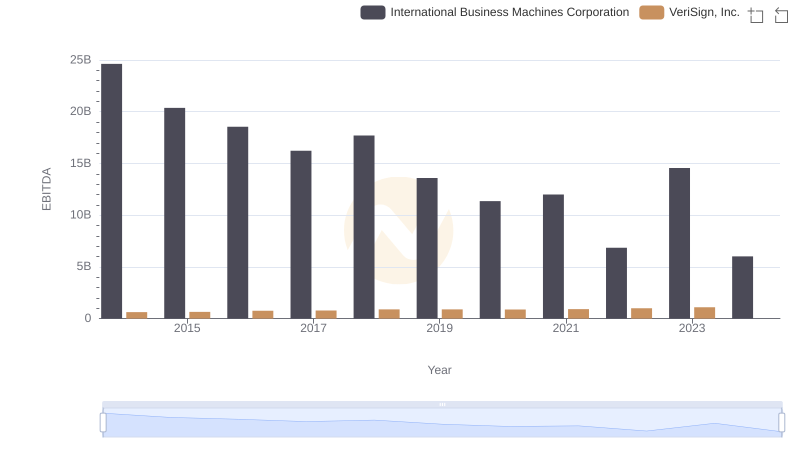
International Business Machines Corporation and VeriSign, Inc.: A Detailed Examination of EBITDA Performance