| __timestamp | FLEETCOR Technologies, Inc. | International Business Machines Corporation |
|---|---|---|
| Wednesday, January 1, 2014 | 173337000 | 46386000000 |
| Thursday, January 1, 2015 | 331073000 | 41057000000 |
| Friday, January 1, 2016 | 355414000 | 41403000000 |
| Sunday, January 1, 2017 | 429613000 | 42196000000 |
| Monday, January 1, 2018 | 487695000 | 42655000000 |
| Tuesday, January 1, 2019 | 530669000 | 26181000000 |
| Wednesday, January 1, 2020 | 596363000 | 24314000000 |
| Friday, January 1, 2021 | 559819000 | 25865000000 |
| Saturday, January 1, 2022 | 764707000 | 27842000000 |
| Sunday, January 1, 2023 | 1030138999 | 27560000000 |
| Monday, January 1, 2024 | 0 | 27202000000 |
Unleashing the power of data
In the ever-evolving landscape of global business, understanding the cost of revenue is crucial for evaluating a company's financial health. This analysis delves into the cost of revenue trends for two industry giants: International Business Machines Corporation (IBM) and FLEETCOR Technologies, Inc., from 2014 to 2023.
IBM, a stalwart in the tech industry, has seen its cost of revenue decrease by approximately 41% over the decade, from 46 billion in 2014 to around 27 billion in 2023. This decline reflects IBM's strategic shift towards more efficient operations and a focus on high-margin services.
Conversely, FLEETCOR, a leader in business payments, has experienced a significant increase in its cost of revenue, surging by nearly 495% from 2014 to 2023. This growth underscores FLEETCOR's aggressive expansion and investment in new markets.
The data for 2024 is incomplete, indicating a need for further analysis as new information becomes available.
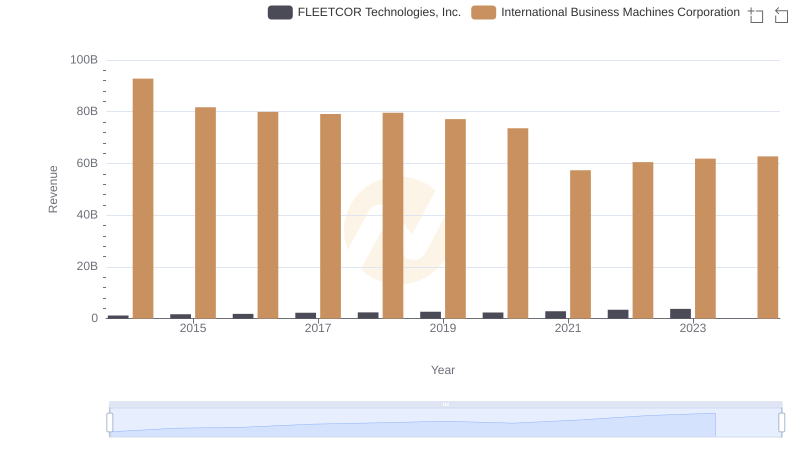
International Business Machines Corporation vs FLEETCOR Technologies, Inc.: Examining Key Revenue Metrics
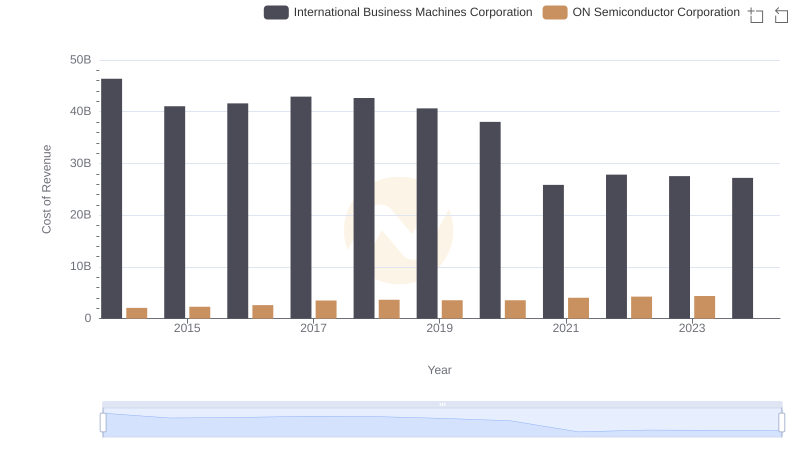
Cost Insights: Breaking Down International Business Machines Corporation and ON Semiconductor Corporation's Expenses

International Business Machines Corporation vs Seagate Technology Holdings plc: Efficiency in Cost of Revenue Explored
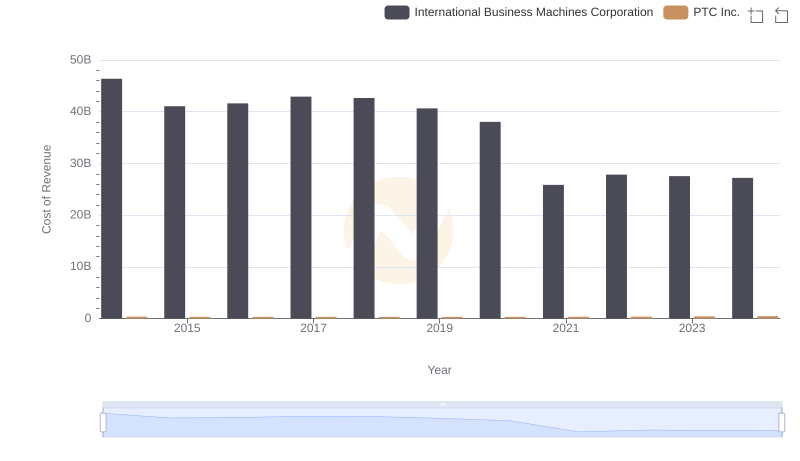
Cost Insights: Breaking Down International Business Machines Corporation and PTC Inc.'s Expenses
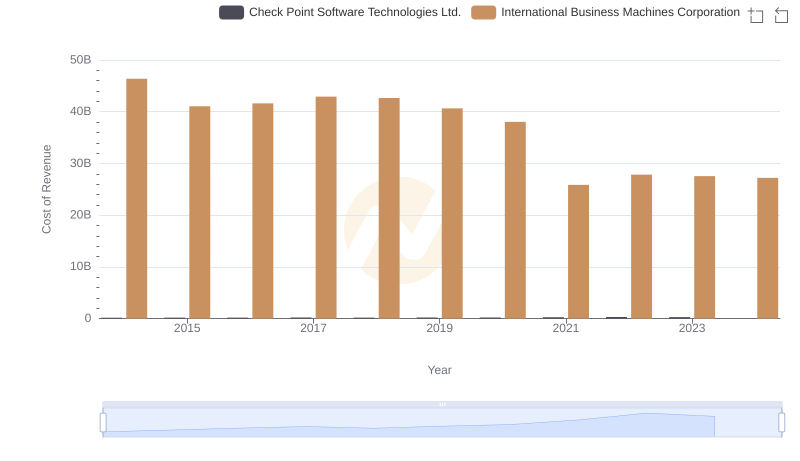
Cost of Revenue: Key Insights for International Business Machines Corporation and Check Point Software Technologies Ltd.

Cost Insights: Breaking Down International Business Machines Corporation and Pure Storage, Inc.'s Expenses
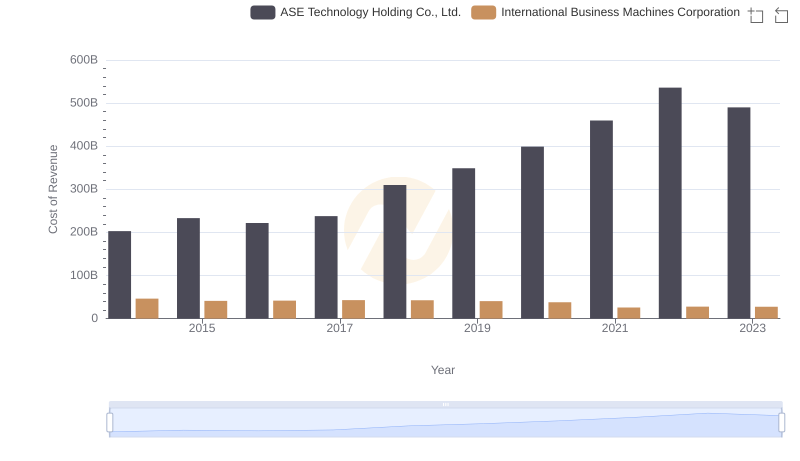
International Business Machines Corporation vs ASE Technology Holding Co., Ltd.: Efficiency in Cost of Revenue Explored
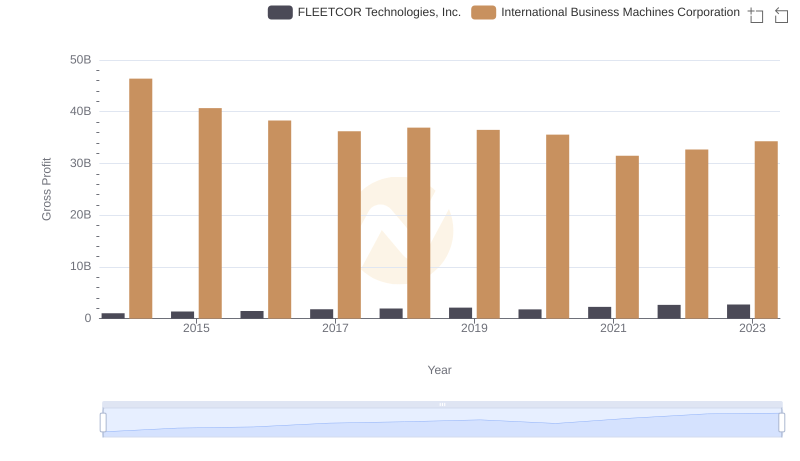
Gross Profit Comparison: International Business Machines Corporation and FLEETCOR Technologies, Inc. Trends
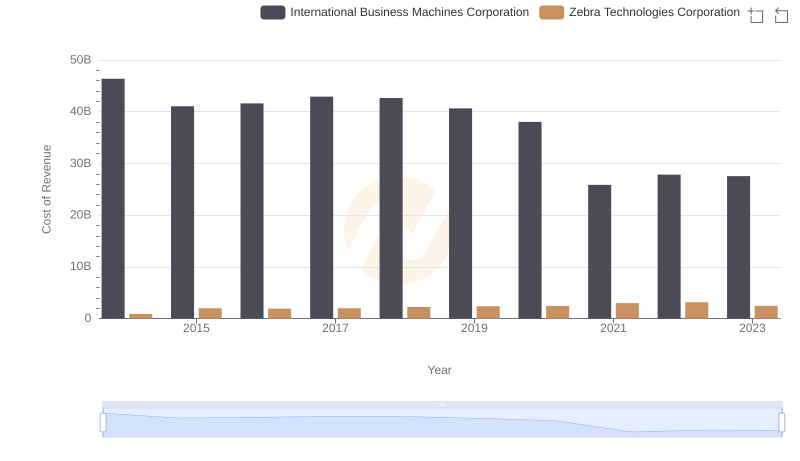
Cost of Revenue Trends: International Business Machines Corporation vs Zebra Technologies Corporation
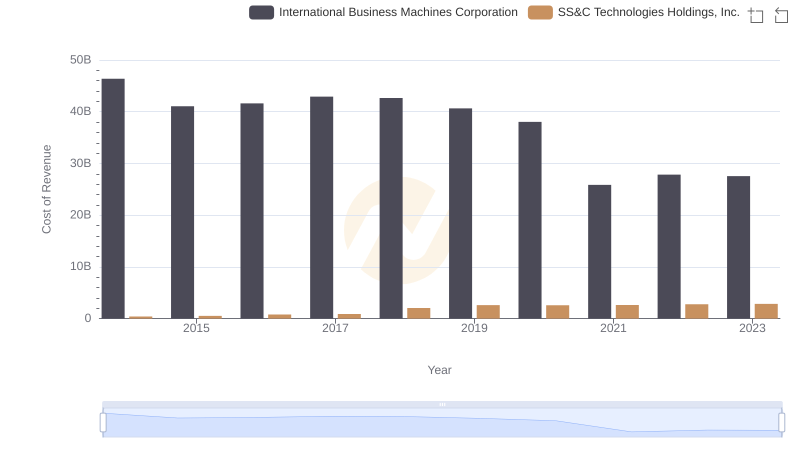
Analyzing Cost of Revenue: International Business Machines Corporation and SS&C Technologies Holdings, Inc.
International Business Machines Corporation vs FLEETCOR Technologies, Inc.: SG&A Expense Trends

International Business Machines Corporation vs FLEETCOR Technologies, Inc.: In-Depth EBITDA Performance Comparison