| __timestamp | International Business Machines Corporation | Zebra Technologies Corporation |
|---|---|---|
| Wednesday, January 1, 2014 | 46386000000 | 892547000 |
| Thursday, January 1, 2015 | 41057000000 | 2007739000 |
| Friday, January 1, 2016 | 41403000000 | 1932000000 |
| Sunday, January 1, 2017 | 42196000000 | 2012000000 |
| Monday, January 1, 2018 | 42655000000 | 2237000000 |
| Tuesday, January 1, 2019 | 26181000000 | 2385000000 |
| Wednesday, January 1, 2020 | 24314000000 | 2445000000 |
| Friday, January 1, 2021 | 25865000000 | 2999000000 |
| Saturday, January 1, 2022 | 27842000000 | 3157000000 |
| Sunday, January 1, 2023 | 27560000000 | 2461000000 |
| Monday, January 1, 2024 | 27202000000 | 2568000000 |
Cracking the code
In the ever-evolving landscape of technology, understanding cost dynamics is crucial. From 2014 to 2023, International Business Machines Corporation (IBM) and Zebra Technologies Corporation have showcased distinct cost of revenue trends. IBM, a stalwart in the tech industry, saw its cost of revenue peak in 2014, with a gradual decline of approximately 41% by 2023. This trend reflects IBM's strategic shift towards more efficient operations and a focus on high-margin services.
Conversely, Zebra Technologies, a leader in enterprise asset intelligence, experienced a steady increase in its cost of revenue, growing by about 176% from 2014 to 2022. This rise underscores Zebra's expansion and investment in innovative solutions. However, data for 2024 remains elusive, hinting at potential shifts in strategy or market conditions.
These trends offer a window into the strategic priorities and market responses of two influential tech giants.
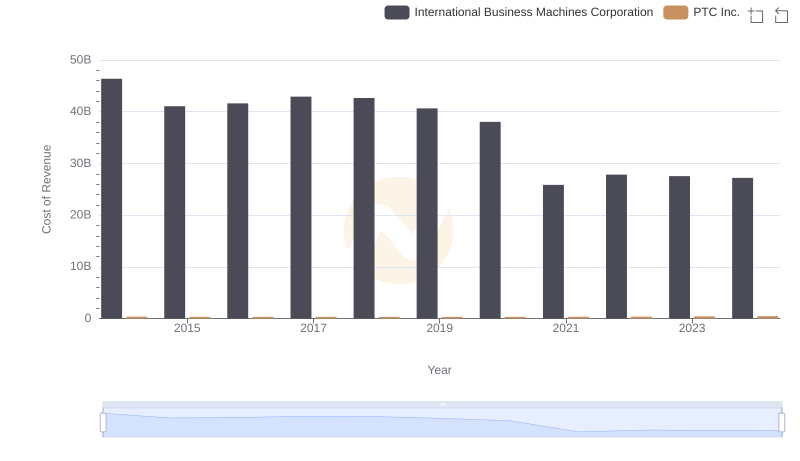
Cost Insights: Breaking Down International Business Machines Corporation and PTC Inc.'s Expenses
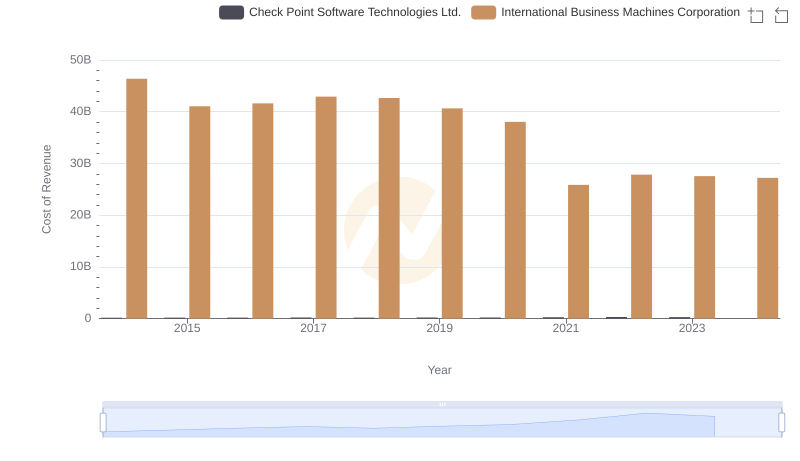
Cost of Revenue: Key Insights for International Business Machines Corporation and Check Point Software Technologies Ltd.
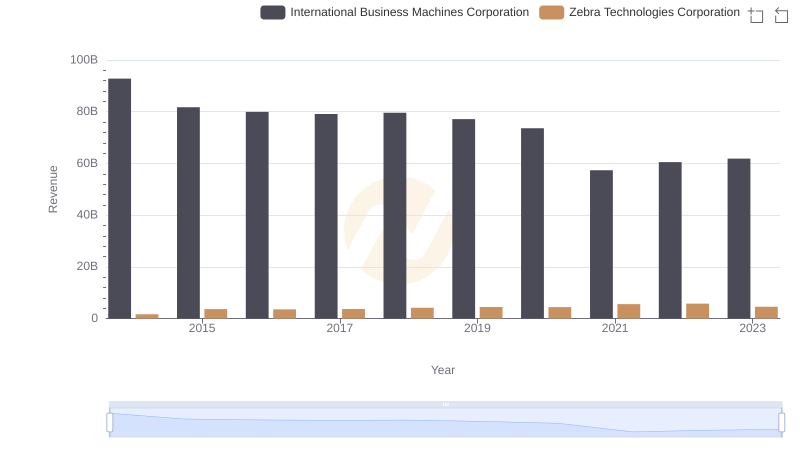
International Business Machines Corporation vs Zebra Technologies Corporation: Examining Key Revenue Metrics

Cost Insights: Breaking Down International Business Machines Corporation and Pure Storage, Inc.'s Expenses
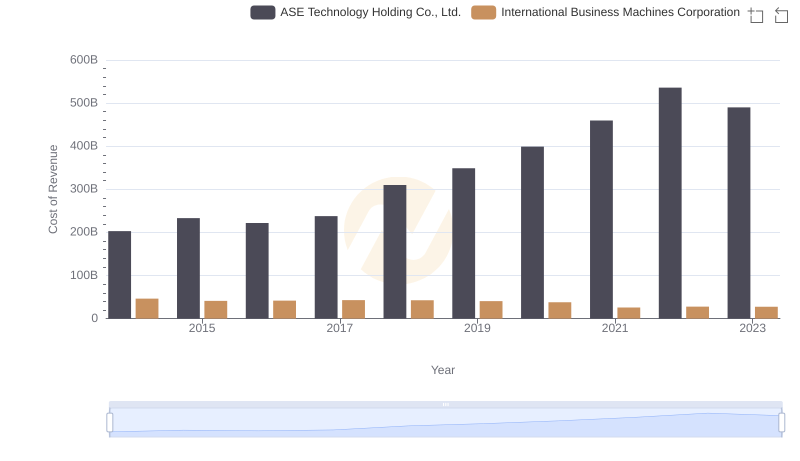
International Business Machines Corporation vs ASE Technology Holding Co., Ltd.: Efficiency in Cost of Revenue Explored
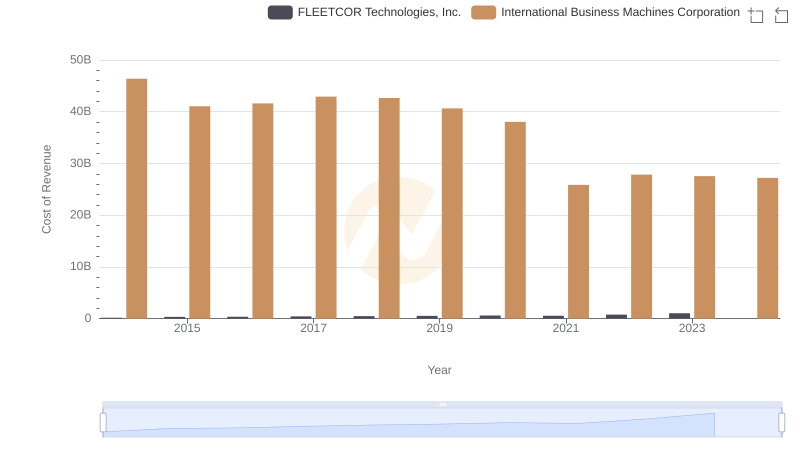
Analyzing Cost of Revenue: International Business Machines Corporation and FLEETCOR Technologies, Inc.
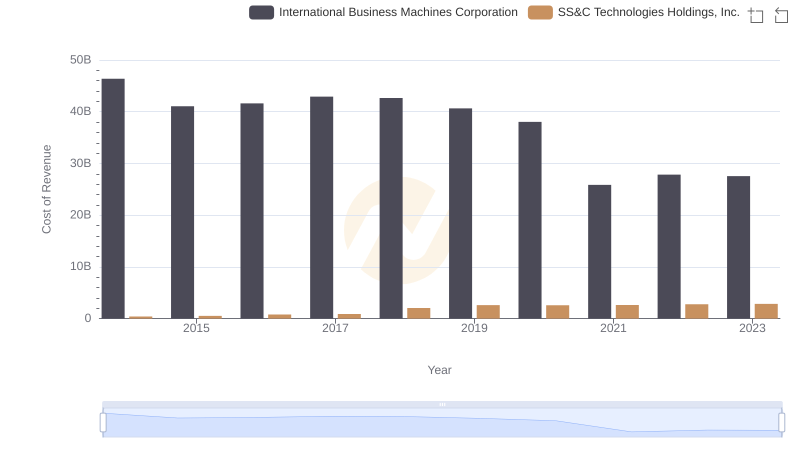
Analyzing Cost of Revenue: International Business Machines Corporation and SS&C Technologies Holdings, Inc.
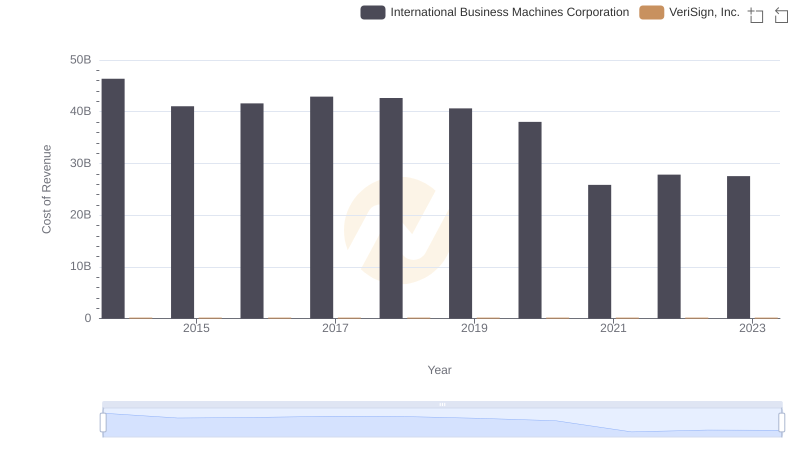
Cost of Revenue: Key Insights for International Business Machines Corporation and VeriSign, Inc.
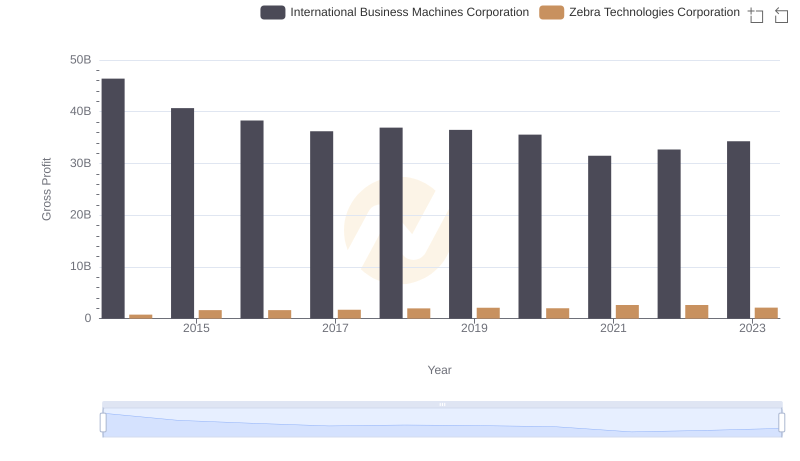
Gross Profit Trends Compared: International Business Machines Corporation vs Zebra Technologies Corporation
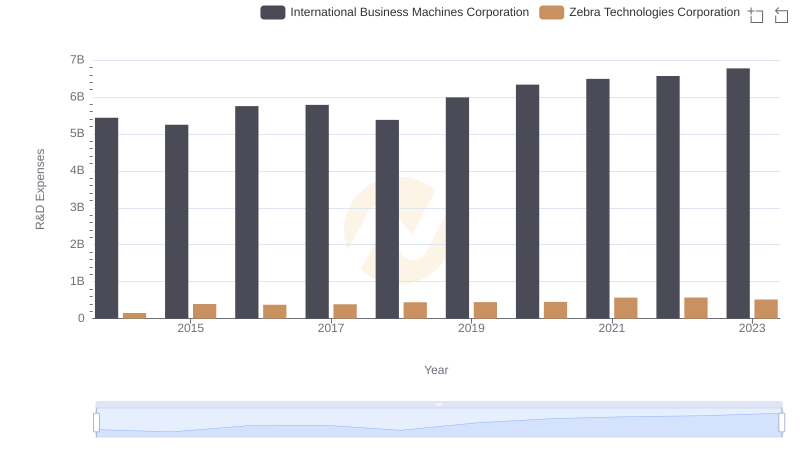
Analyzing R&D Budgets: International Business Machines Corporation vs Zebra Technologies Corporation
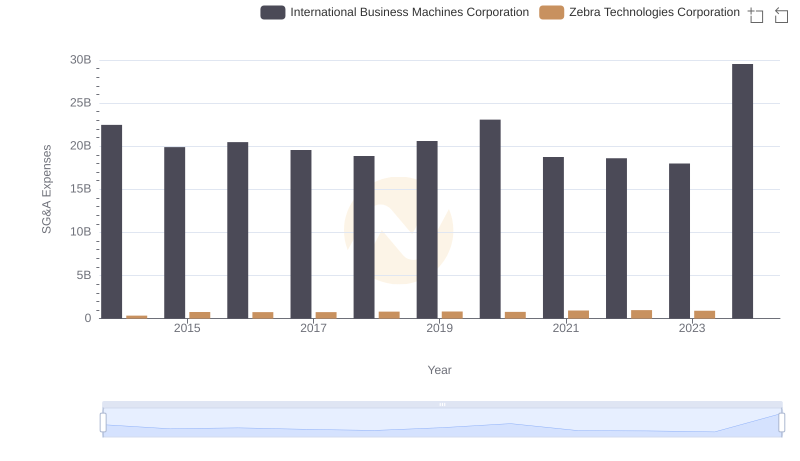
Who Optimizes SG&A Costs Better? International Business Machines Corporation or Zebra Technologies Corporation
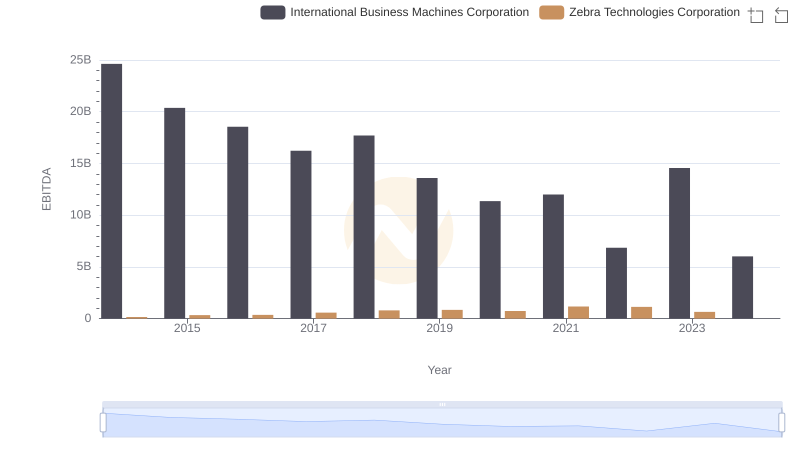
A Side-by-Side Analysis of EBITDA: International Business Machines Corporation and Zebra Technologies Corporation