| __timestamp | Check Point Software Technologies Ltd. | International Business Machines Corporation |
|---|---|---|
| Wednesday, January 1, 2014 | 176541000 | 46386000000 |
| Thursday, January 1, 2015 | 189057000 | 41057000000 |
| Friday, January 1, 2016 | 202003000 | 41403000000 |
| Sunday, January 1, 2017 | 212963000 | 42196000000 |
| Monday, January 1, 2018 | 201379000 | 42655000000 |
| Tuesday, January 1, 2019 | 215400000 | 26181000000 |
| Wednesday, January 1, 2020 | 226500000 | 24314000000 |
| Friday, January 1, 2021 | 258100000 | 25865000000 |
| Saturday, January 1, 2022 | 304400000 | 27842000000 |
| Sunday, January 1, 2023 | 282600000 | 27560000000 |
| Monday, January 1, 2024 | 27202000000 |
Unlocking the unknown
In the ever-evolving tech industry, understanding cost structures is crucial for strategic planning. This analysis delves into the cost of revenue for two tech giants: International Business Machines Corporation (IBM) and Check Point Software Technologies Ltd. Over the past decade, IBM's cost of revenue has seen a significant decline, dropping from approximately $46 billion in 2014 to around $27 billion in 2023. This represents a reduction of nearly 41%, indicating a strategic shift towards more efficient operations. In contrast, Check Point Software Technologies Ltd. has experienced a steady increase in its cost of revenue, growing by about 60% from 2014 to 2023. This growth reflects the company's expansion and increased investment in its offerings. Notably, data for 2024 is incomplete, highlighting the dynamic nature of financial forecasting. These insights provide a window into the financial strategies of these industry leaders.
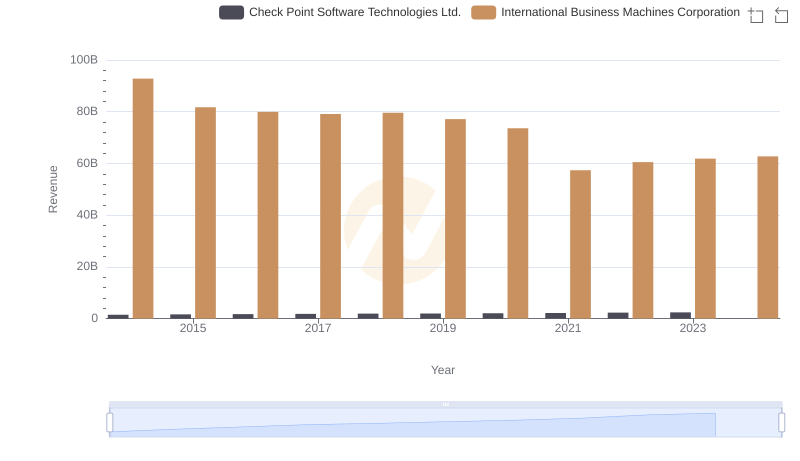
Annual Revenue Comparison: International Business Machines Corporation vs Check Point Software Technologies Ltd.
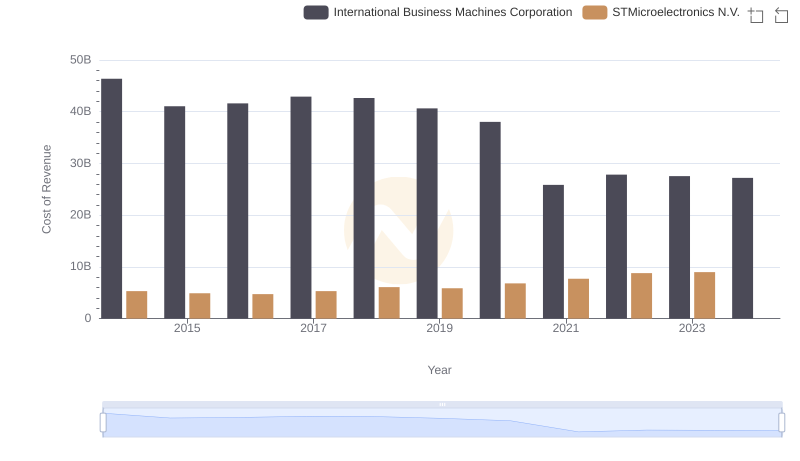
Cost of Revenue Comparison: International Business Machines Corporation vs STMicroelectronics N.V.
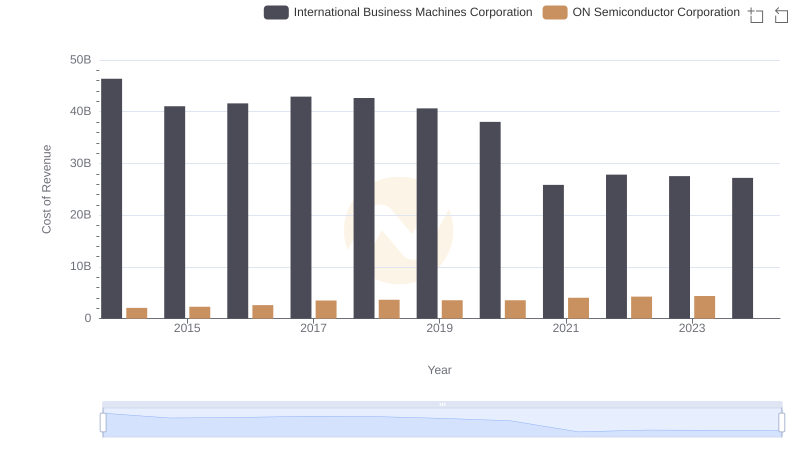
Cost Insights: Breaking Down International Business Machines Corporation and ON Semiconductor Corporation's Expenses

International Business Machines Corporation vs Seagate Technology Holdings plc: Efficiency in Cost of Revenue Explored
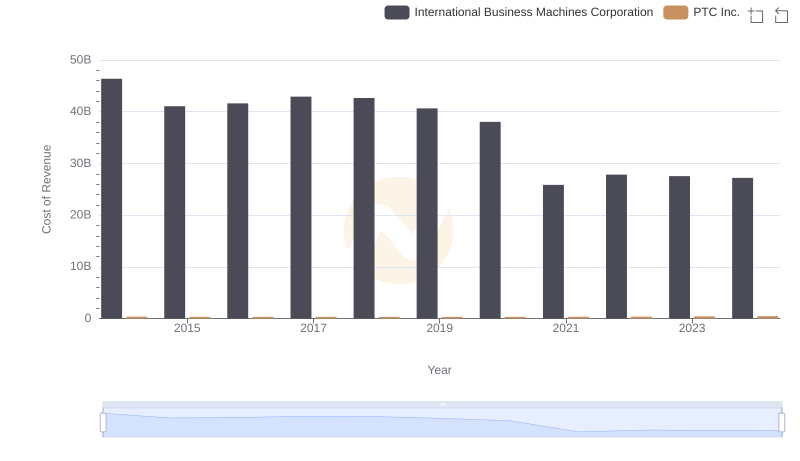
Cost Insights: Breaking Down International Business Machines Corporation and PTC Inc.'s Expenses

Cost Insights: Breaking Down International Business Machines Corporation and Pure Storage, Inc.'s Expenses
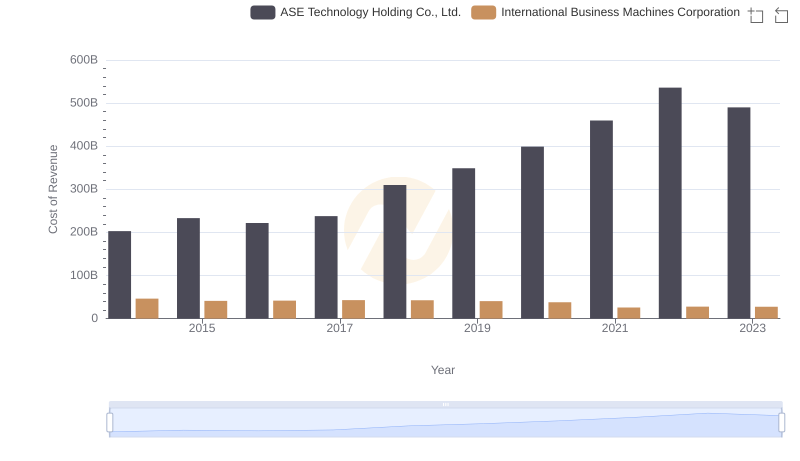
International Business Machines Corporation vs ASE Technology Holding Co., Ltd.: Efficiency in Cost of Revenue Explored
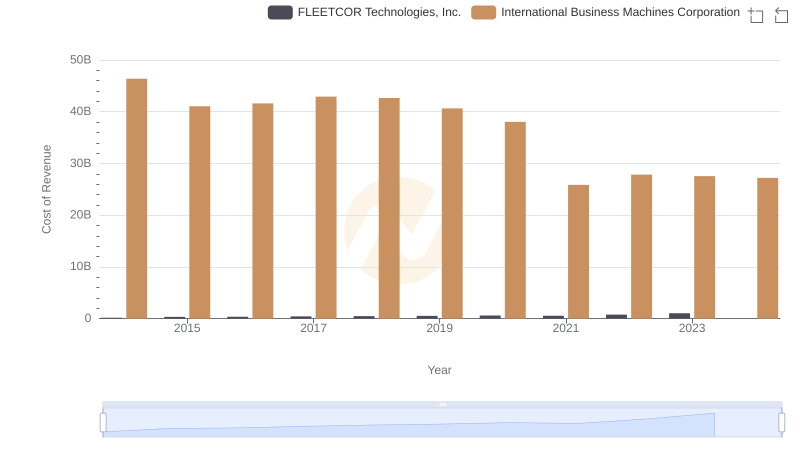
Analyzing Cost of Revenue: International Business Machines Corporation and FLEETCOR Technologies, Inc.
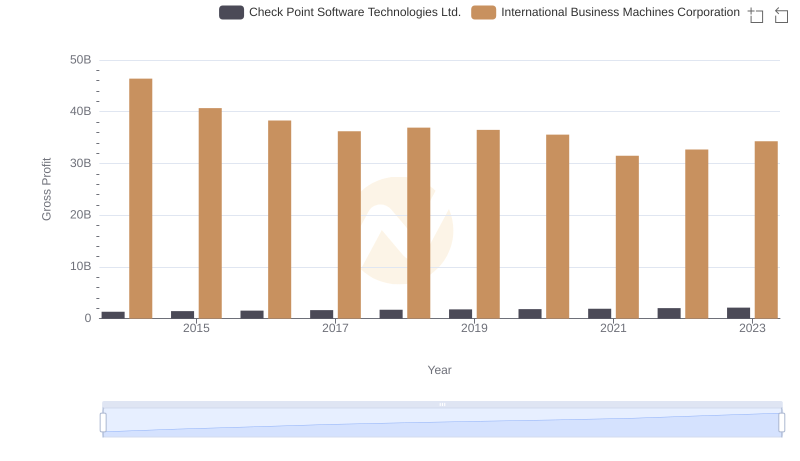
Key Insights on Gross Profit: International Business Machines Corporation vs Check Point Software Technologies Ltd.
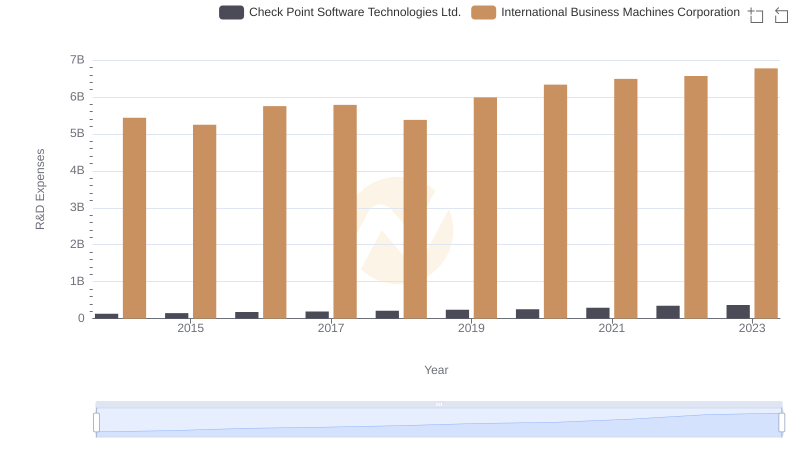
Research and Development Investment: International Business Machines Corporation vs Check Point Software Technologies Ltd.
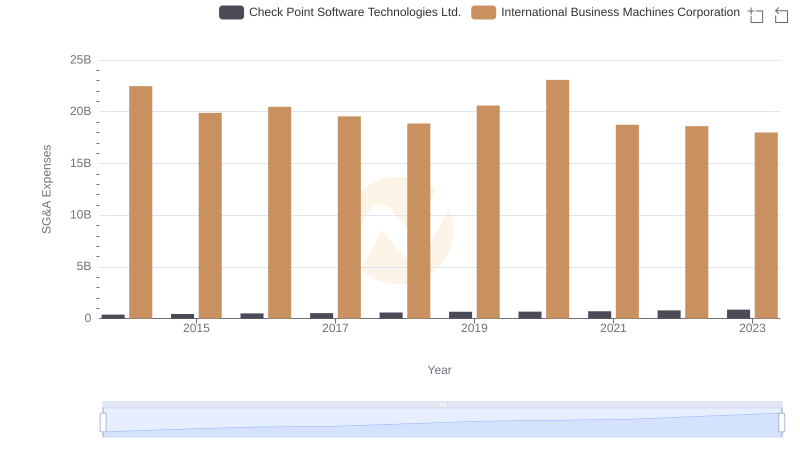
Operational Costs Compared: SG&A Analysis of International Business Machines Corporation and Check Point Software Technologies Ltd.
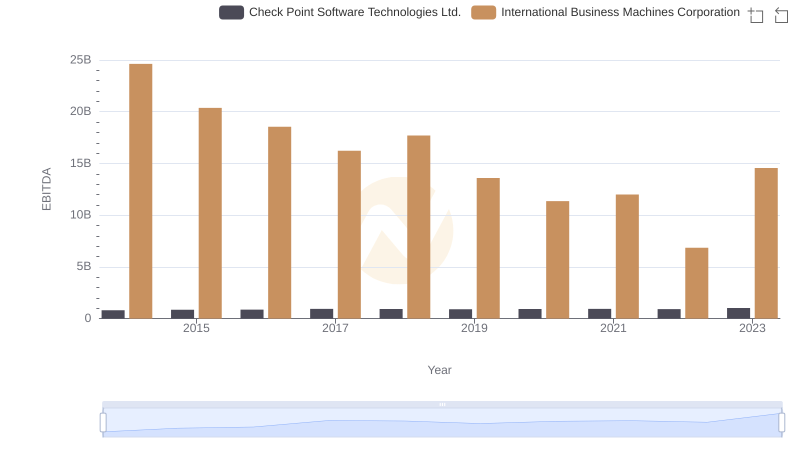
International Business Machines Corporation and Check Point Software Technologies Ltd.: A Detailed Examination of EBITDA Performance