| __timestamp | International Business Machines Corporation | Nokia Oyj |
|---|---|---|
| Wednesday, January 1, 2014 | 46407000000 | 5638000000 |
| Thursday, January 1, 2015 | 40684000000 | 5454000000 |
| Friday, January 1, 2016 | 38516000000 | 8457000000 |
| Sunday, January 1, 2017 | 36943000000 | 9138000000 |
| Monday, January 1, 2018 | 36936000000 | 8446000000 |
| Tuesday, January 1, 2019 | 31533000000 | 8326000000 |
| Wednesday, January 1, 2020 | 30865000000 | 8214000000 |
| Friday, January 1, 2021 | 31486000000 | 8834000000 |
| Saturday, January 1, 2022 | 32687000000 | 10222000000 |
| Sunday, January 1, 2023 | 34300000000 | 8687000000 |
| Monday, January 1, 2024 | 35551000000 |
In pursuit of knowledge
In the ever-evolving tech landscape, the financial performance of giants like International Business Machines Corporation (IBM) and Nokia Oyj offers a fascinating glimpse into industry dynamics. From 2014 to 2023, IBM's gross profit has seen a decline of approximately 26%, from a peak in 2014 to a low in 2021, before a slight recovery in 2023. Meanwhile, Nokia's gross profit has shown a more stable trajectory, with a notable 88% increase from 2015 to 2022, peaking in 2022. This divergence highlights IBM's challenges in maintaining its market dominance, while Nokia's strategic shifts have bolstered its financial health. The data for 2024 remains incomplete, leaving room for speculation on future trends. As these companies navigate the complexities of the global market, their financial journeys provide valuable insights into the broader tech industry's evolution.
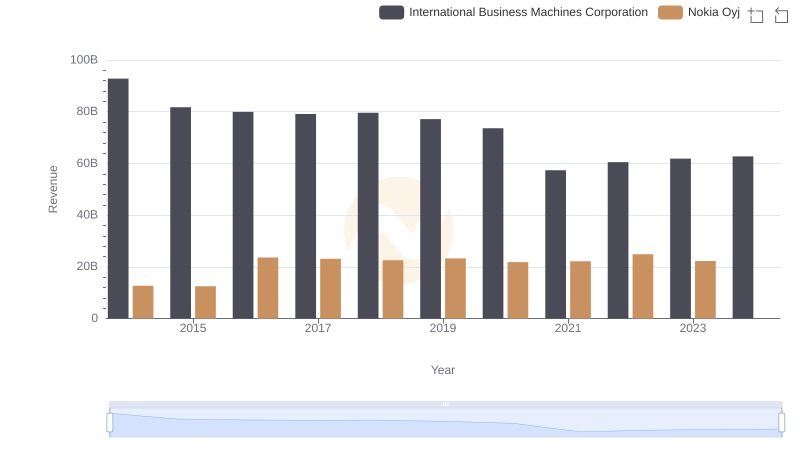
International Business Machines Corporation or Nokia Oyj: Who Leads in Yearly Revenue?
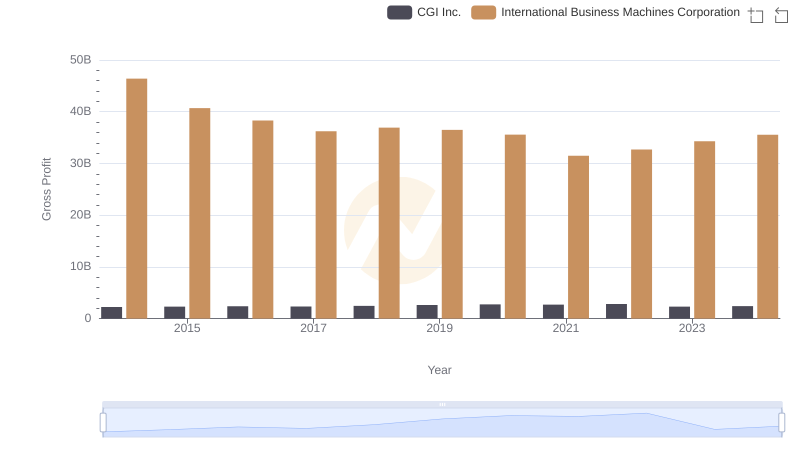
International Business Machines Corporation and CGI Inc.: A Detailed Gross Profit Analysis
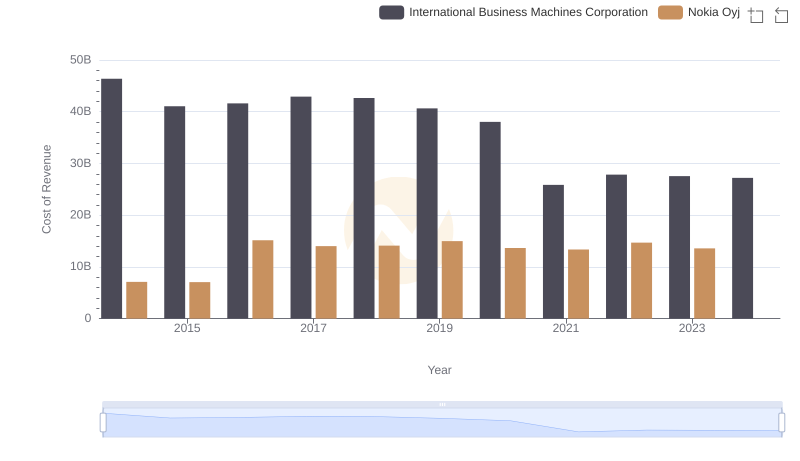
Analyzing Cost of Revenue: International Business Machines Corporation and Nokia Oyj

Gross Profit Trends Compared: International Business Machines Corporation vs NetApp, Inc.
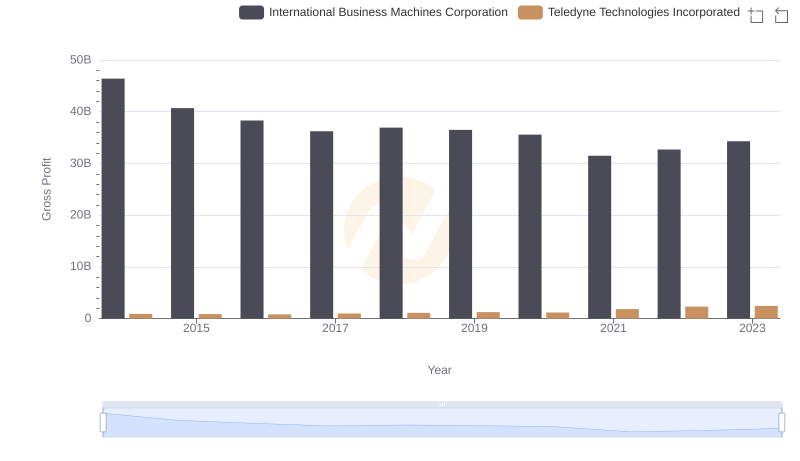
International Business Machines Corporation and Teledyne Technologies Incorporated: A Detailed Gross Profit Analysis
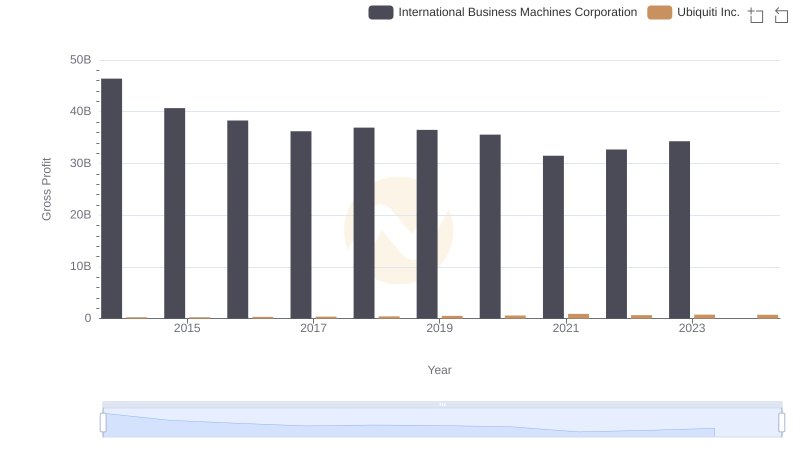
Who Generates Higher Gross Profit? International Business Machines Corporation or Ubiquiti Inc.
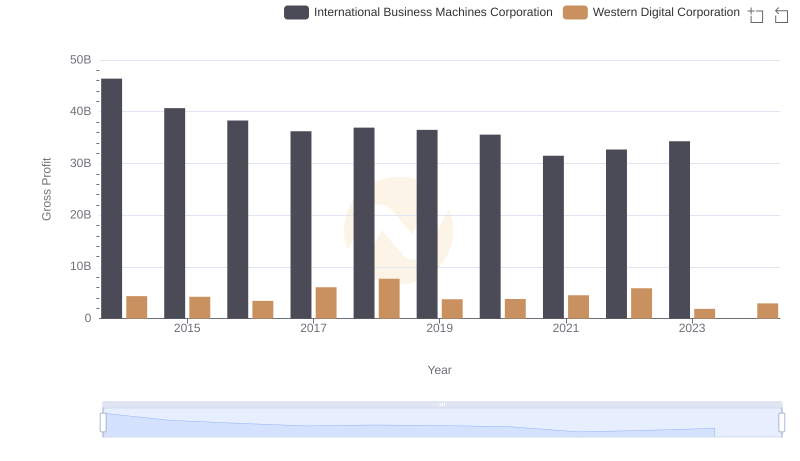
Gross Profit Trends Compared: International Business Machines Corporation vs Western Digital Corporation
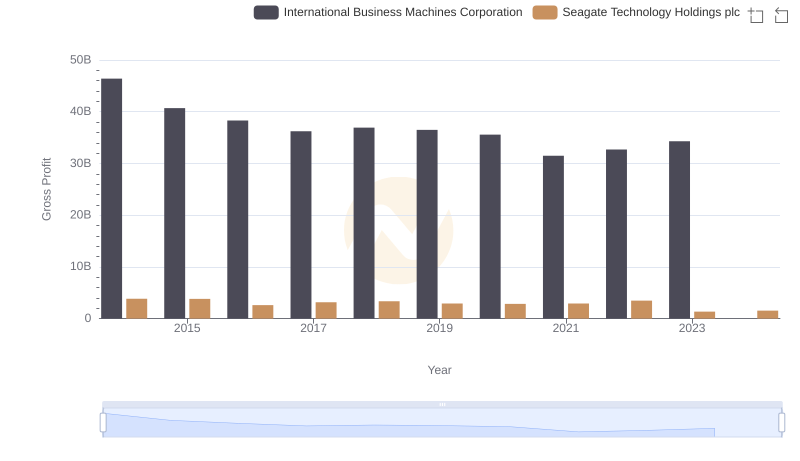
International Business Machines Corporation vs Seagate Technology Holdings plc: A Gross Profit Performance Breakdown
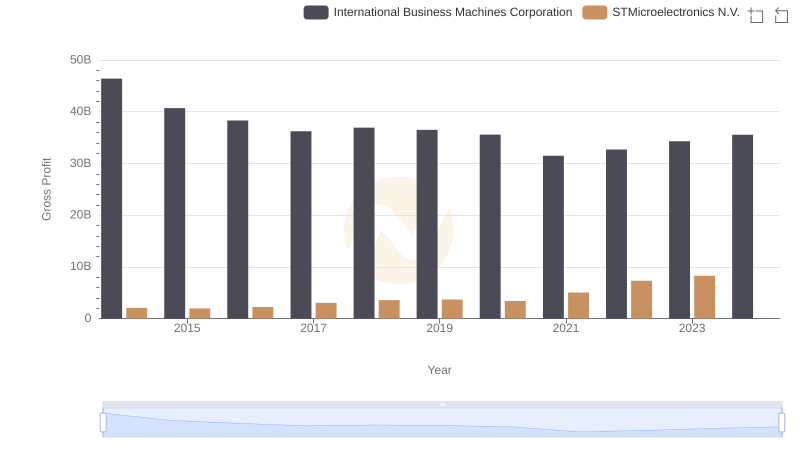
Who Generates Higher Gross Profit? International Business Machines Corporation or STMicroelectronics N.V.
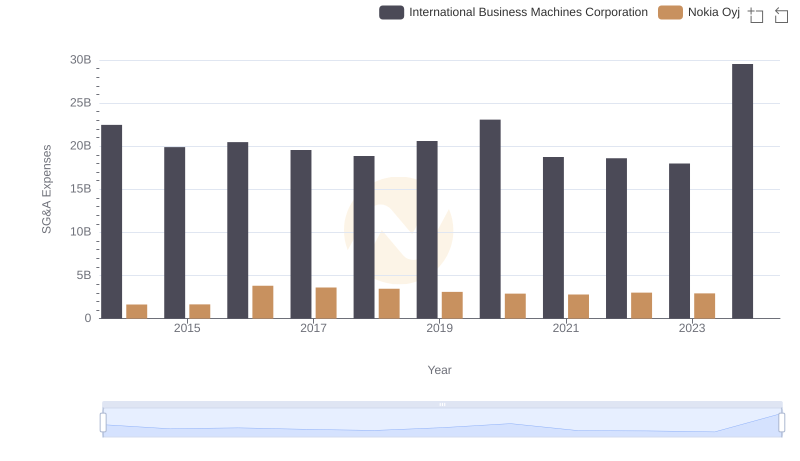
SG&A Efficiency Analysis: Comparing International Business Machines Corporation and Nokia Oyj
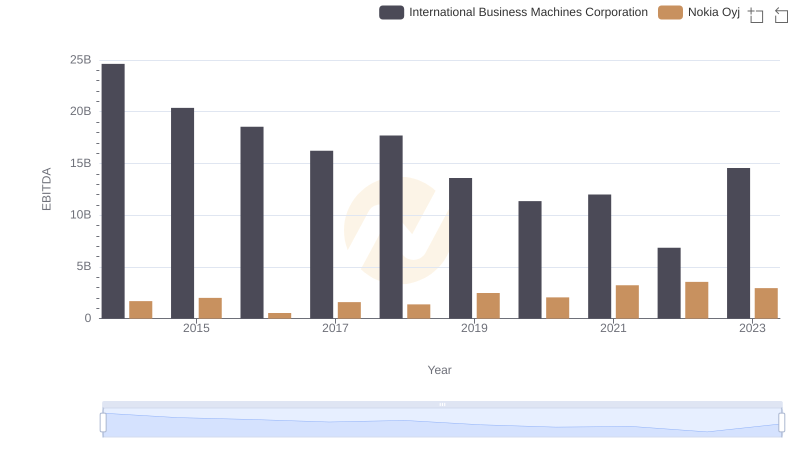
Professional EBITDA Benchmarking: International Business Machines Corporation vs Nokia Oyj