| __timestamp | Paychex, Inc. | Waste Management, Inc. |
|---|---|---|
| Wednesday, January 1, 2014 | 1786400000 | 4994000000 |
| Thursday, January 1, 2015 | 1931600000 | 4730000000 |
| Friday, January 1, 2016 | 2094800000 | 5123000000 |
| Sunday, January 1, 2017 | 2231700000 | 5464000000 |
| Monday, January 1, 2018 | 2363100000 | 5665000000 |
| Tuesday, January 1, 2019 | 2594700000 | 5959000000 |
| Wednesday, January 1, 2020 | 2759700000 | 5877000000 |
| Friday, January 1, 2021 | 2785600000 | 6820000000 |
| Saturday, January 1, 2022 | 3255400000 | 7404000000 |
| Sunday, January 1, 2023 | 3554100000 | 7820000000 |
| Monday, January 1, 2024 | 3799000000 | 8680000000 |
Data in motion
In the ever-evolving landscape of American business, Waste Management, Inc. and Paychex, Inc. have emerged as leaders in their respective industries. From 2014 to 2023, Waste Management's gross profit surged by approximately 57%, reflecting its robust growth in the waste management sector. Meanwhile, Paychex, a key player in human resource services, saw its gross profit increase by nearly 99% over the same period, showcasing its resilience and adaptability in a competitive market.
The data reveals a consistent upward trajectory for both companies, with Waste Management peaking at a gross profit of $7.82 billion in 2023, while Paychex reached $3.55 billion. Notably, 2024 data for Waste Management is missing, leaving room for speculation on its future performance. This comparison highlights the dynamic nature of these industries and the strategic maneuvers that have propelled these companies forward.
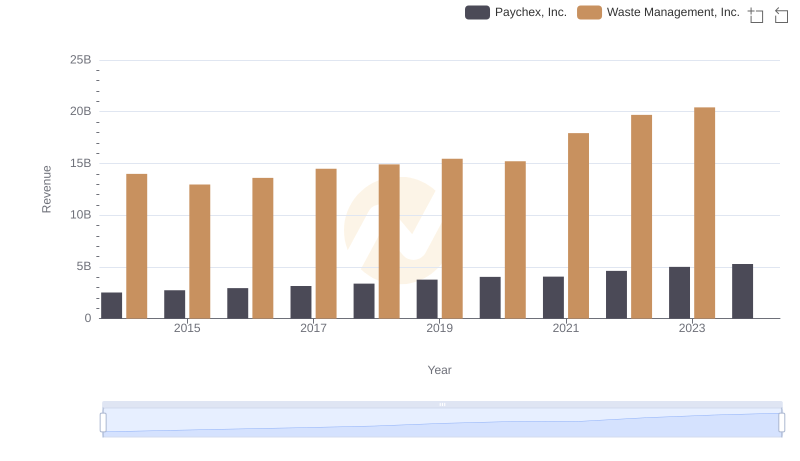
Comparing Revenue Performance: Waste Management, Inc. or Paychex, Inc.?
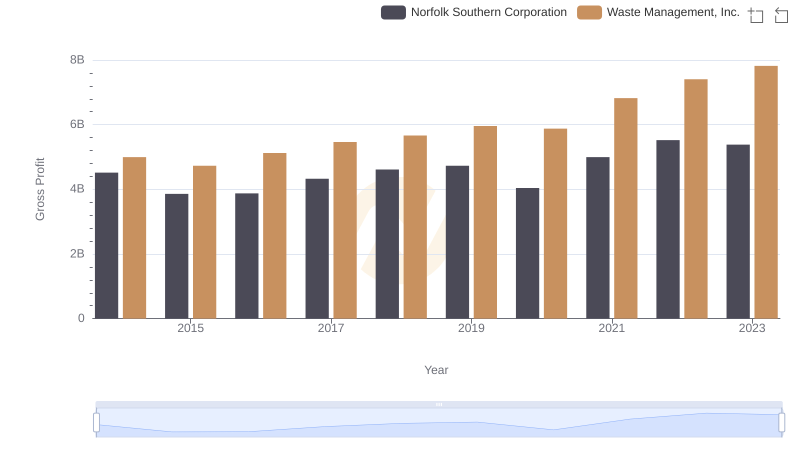
Gross Profit Analysis: Comparing Waste Management, Inc. and Norfolk Southern Corporation
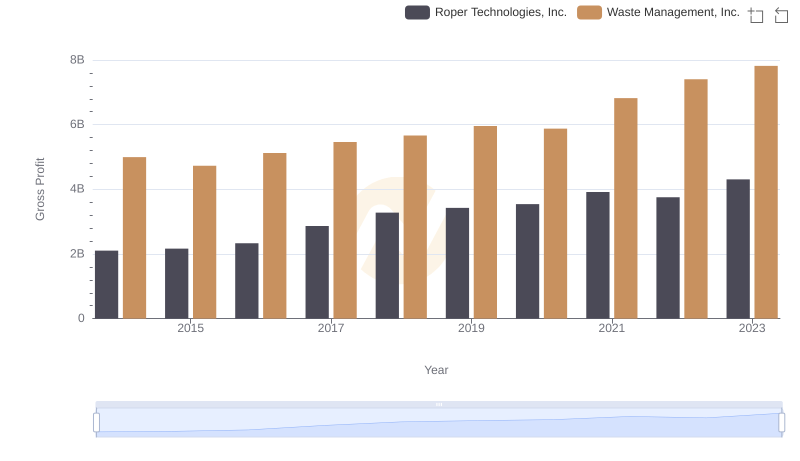
Who Generates Higher Gross Profit? Waste Management, Inc. or Roper Technologies, Inc.
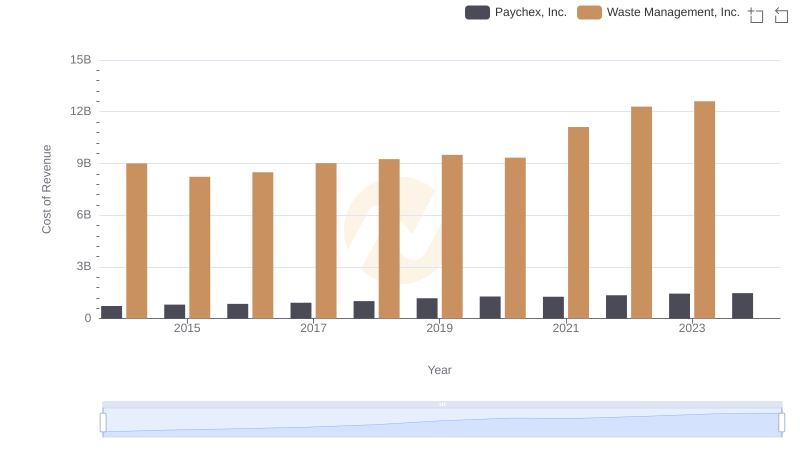
Cost of Revenue Comparison: Waste Management, Inc. vs Paychex, Inc.
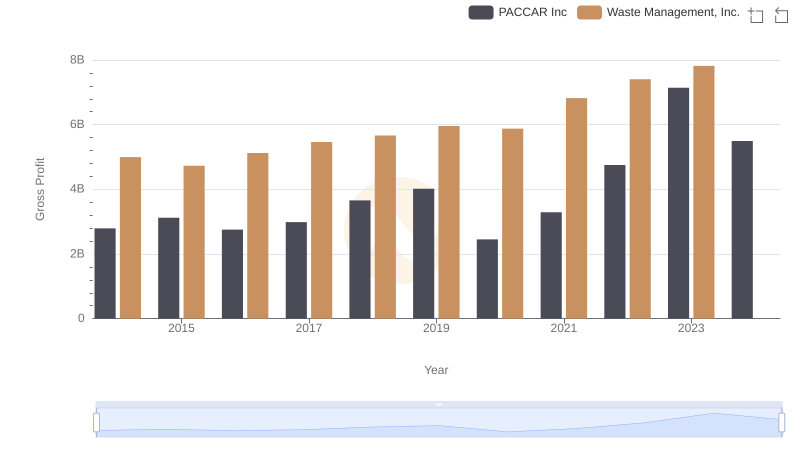
Key Insights on Gross Profit: Waste Management, Inc. vs PACCAR Inc
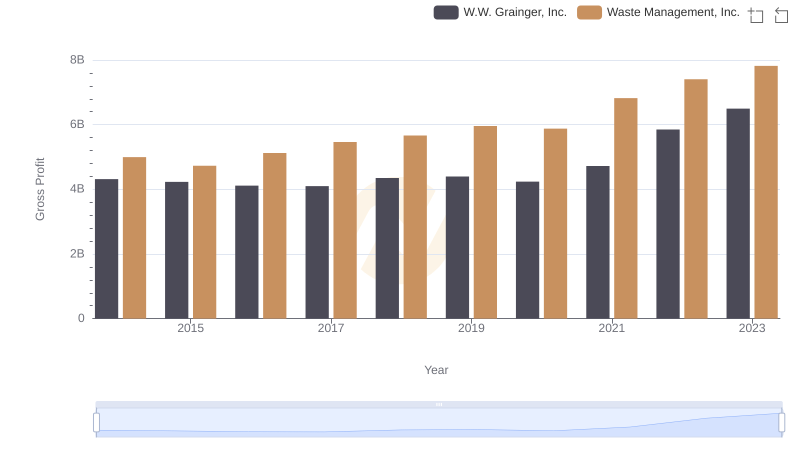
Gross Profit Trends Compared: Waste Management, Inc. vs W.W. Grainger, Inc.
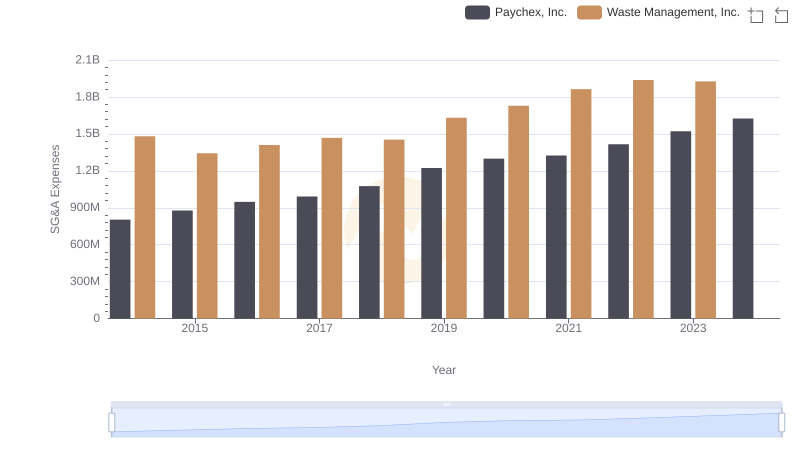
Waste Management, Inc. or Paychex, Inc.: Who Manages SG&A Costs Better?
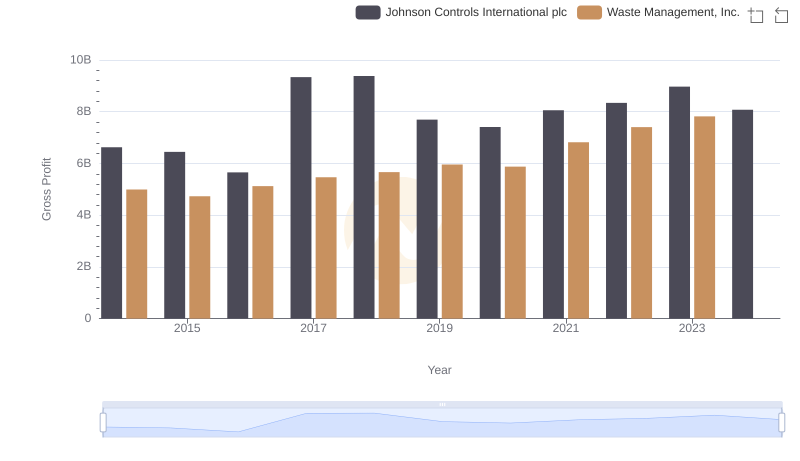
Waste Management, Inc. and Johnson Controls International plc: A Detailed Gross Profit Analysis
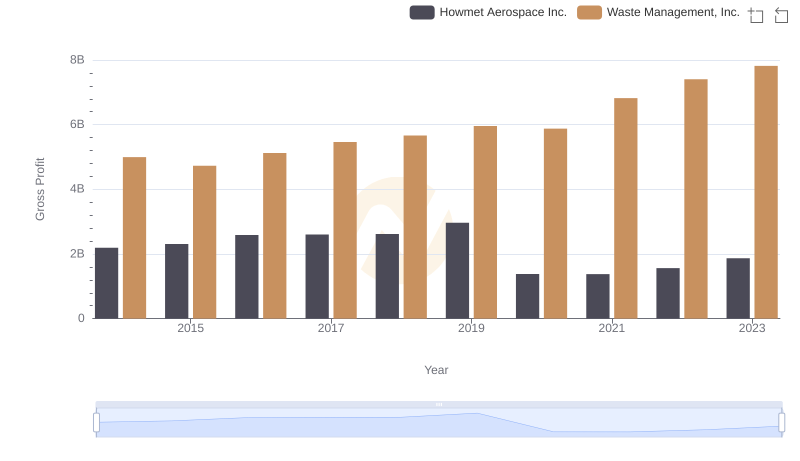
Gross Profit Comparison: Waste Management, Inc. and Howmet Aerospace Inc. Trends
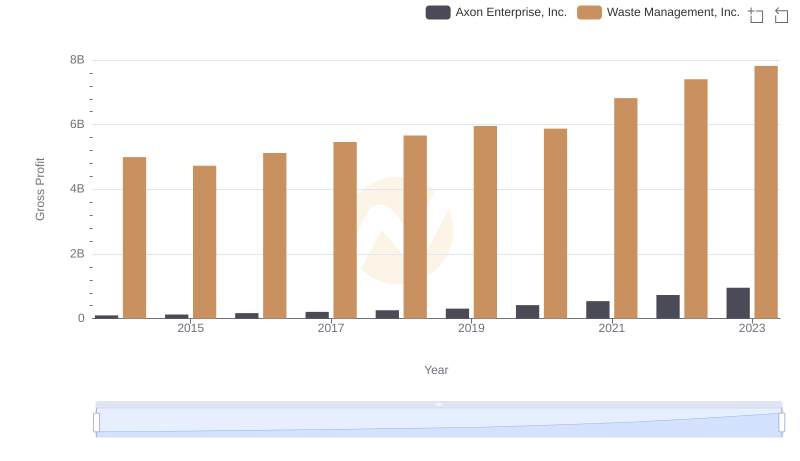
Gross Profit Comparison: Waste Management, Inc. and Axon Enterprise, Inc. Trends
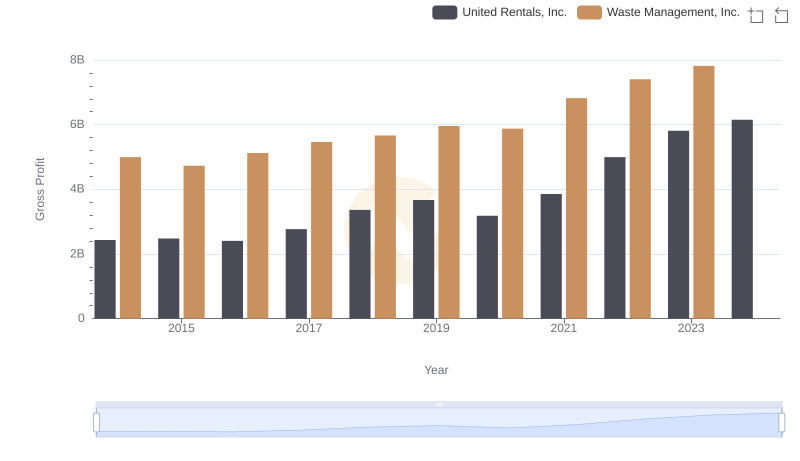
Who Generates Higher Gross Profit? Waste Management, Inc. or United Rentals, Inc.