| __timestamp | Johnson Controls International plc | Waste Management, Inc. |
|---|---|---|
| Wednesday, January 1, 2014 | 6627000000 | 4994000000 |
| Thursday, January 1, 2015 | 6447000000 | 4730000000 |
| Friday, January 1, 2016 | 5654000000 | 5123000000 |
| Sunday, January 1, 2017 | 9339000000 | 5464000000 |
| Monday, January 1, 2018 | 9380000000 | 5665000000 |
| Tuesday, January 1, 2019 | 7693000000 | 5959000000 |
| Wednesday, January 1, 2020 | 7411000000 | 5877000000 |
| Friday, January 1, 2021 | 8059000000 | 6820000000 |
| Saturday, January 1, 2022 | 8343000000 | 7404000000 |
| Sunday, January 1, 2023 | 8971000000 | 7820000000 |
| Monday, January 1, 2024 | 8077000000 | 8680000000 |
In pursuit of knowledge
In the ever-evolving landscape of corporate finance, understanding the gross profit trends of industry giants like Waste Management, Inc. and Johnson Controls International plc offers valuable insights. Over the past decade, from 2014 to 2023, Johnson Controls has consistently outperformed Waste Management in terms of gross profit, with an average of approximately $7.8 billion annually. Notably, 2017 marked a peak year for Johnson Controls, achieving a gross profit of $9.3 billion, a 65% increase from its 2016 figures. Meanwhile, Waste Management has shown a steady upward trajectory, culminating in a 58% rise from 2014 to 2023, reaching $7.8 billion. However, data for 2024 remains incomplete, highlighting the need for continuous monitoring. This analysis underscores the dynamic nature of these companies' financial health, providing a window into their strategic growth and market positioning.

Comparing Revenue Performance: Waste Management, Inc. or Johnson Controls International plc?
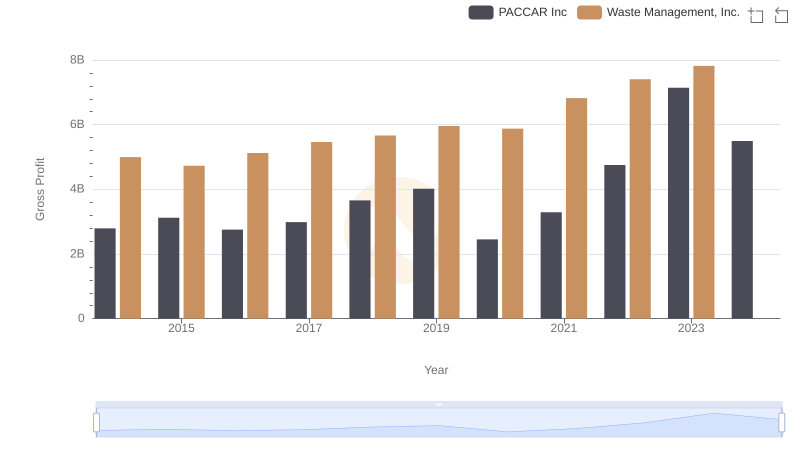
Key Insights on Gross Profit: Waste Management, Inc. vs PACCAR Inc
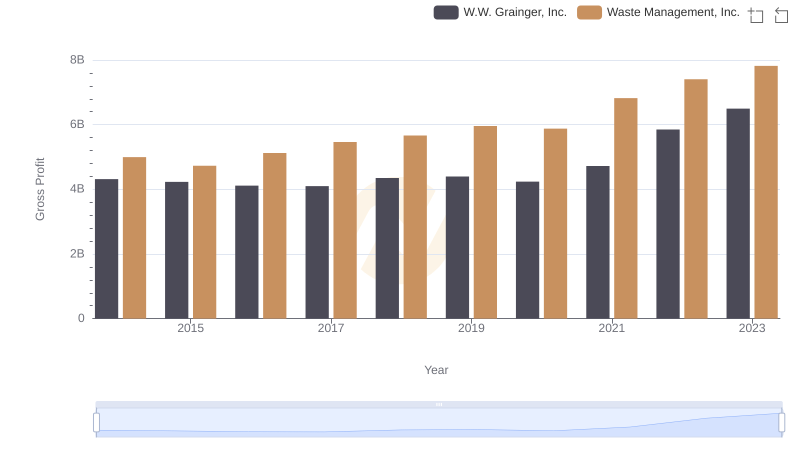
Gross Profit Trends Compared: Waste Management, Inc. vs W.W. Grainger, Inc.
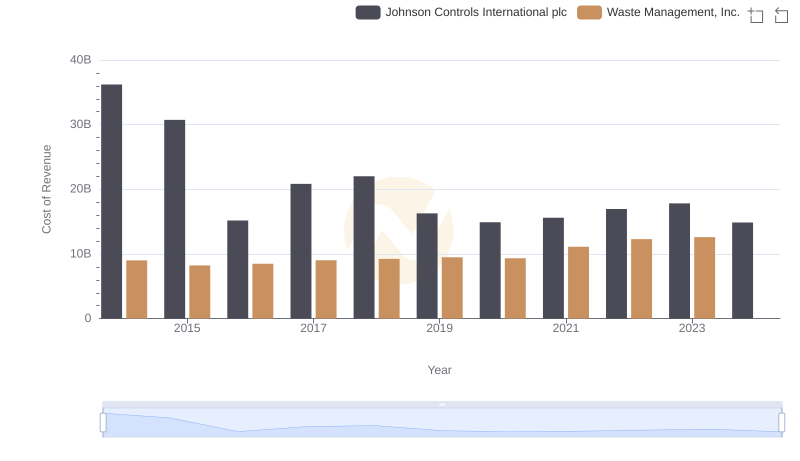
Cost Insights: Breaking Down Waste Management, Inc. and Johnson Controls International plc's Expenses
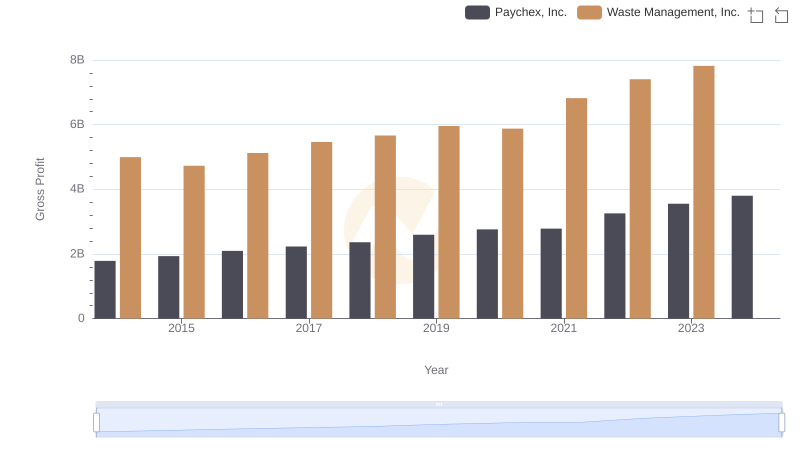
Gross Profit Comparison: Waste Management, Inc. and Paychex, Inc. Trends
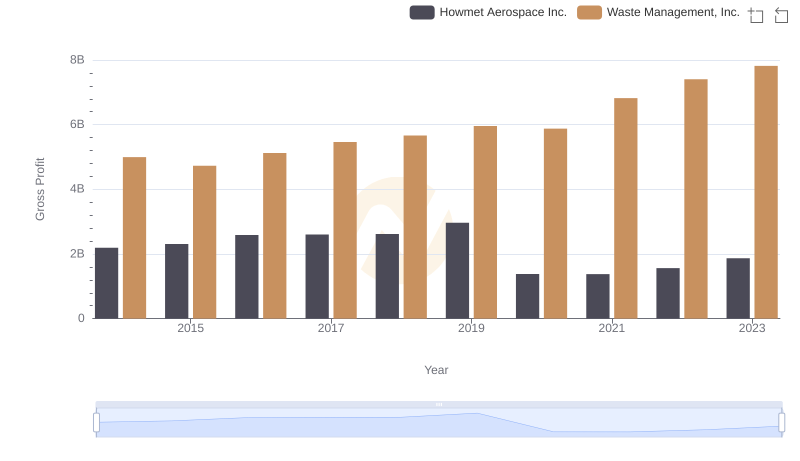
Gross Profit Comparison: Waste Management, Inc. and Howmet Aerospace Inc. Trends
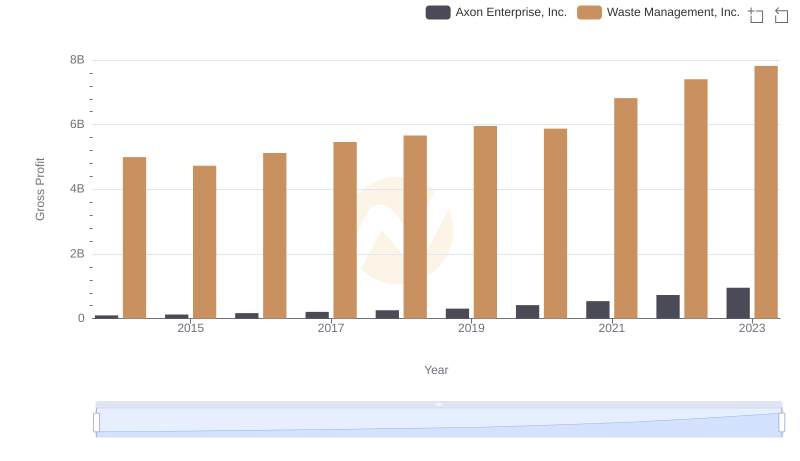
Gross Profit Comparison: Waste Management, Inc. and Axon Enterprise, Inc. Trends
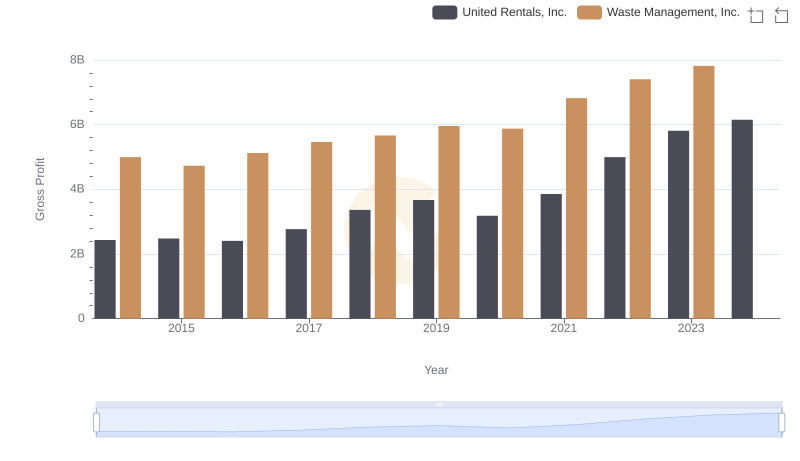
Who Generates Higher Gross Profit? Waste Management, Inc. or United Rentals, Inc.
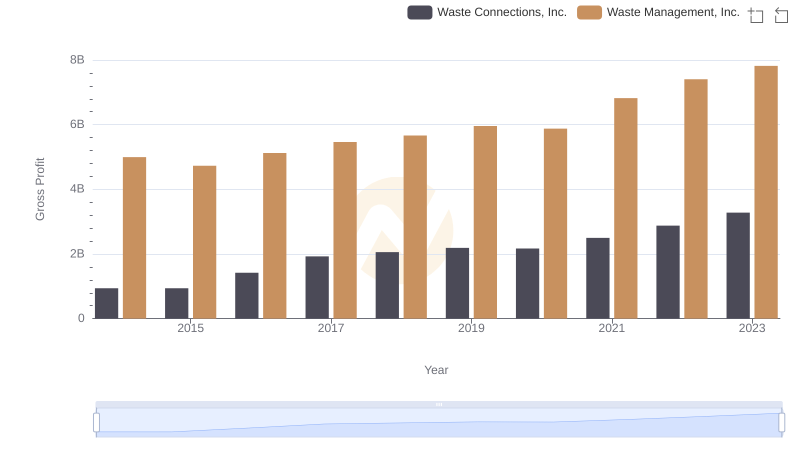
Waste Management, Inc. and Waste Connections, Inc.: A Detailed Gross Profit Analysis
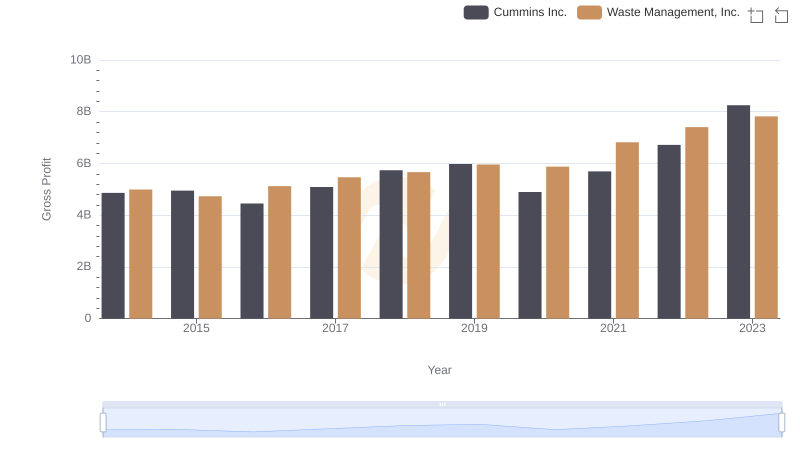
Who Generates Higher Gross Profit? Waste Management, Inc. or Cummins Inc.
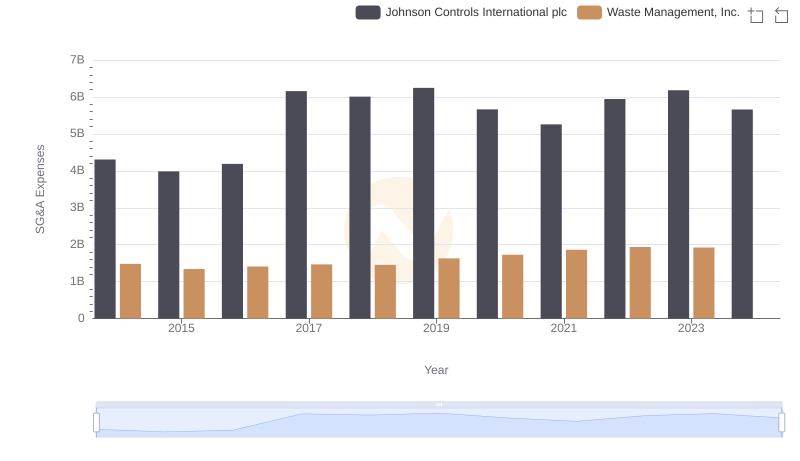
Waste Management, Inc. and Johnson Controls International plc: SG&A Spending Patterns Compared
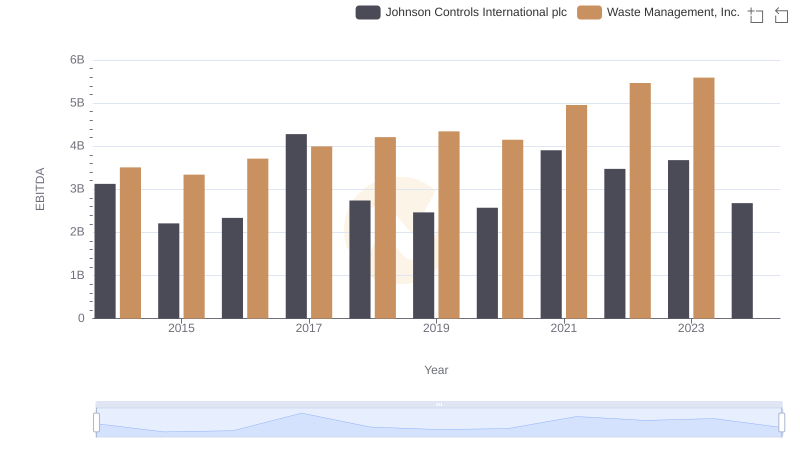
EBITDA Metrics Evaluated: Waste Management, Inc. vs Johnson Controls International plc