| __timestamp | PACCAR Inc | Waste Management, Inc. |
|---|---|---|
| Wednesday, January 1, 2014 | 2793200000 | 4994000000 |
| Thursday, January 1, 2015 | 3121300000 | 4730000000 |
| Friday, January 1, 2016 | 2753200000 | 5123000000 |
| Sunday, January 1, 2017 | 2985600000 | 5464000000 |
| Monday, January 1, 2018 | 3655800000 | 5665000000 |
| Tuesday, January 1, 2019 | 4015400000 | 5959000000 |
| Wednesday, January 1, 2020 | 2452000000 | 5877000000 |
| Friday, January 1, 2021 | 3291900000 | 6820000000 |
| Saturday, January 1, 2022 | 4751600000 | 7404000000 |
| Sunday, January 1, 2023 | 7141900000 | 7820000000 |
| Monday, January 1, 2024 | 5494700000 | 8680000000 |
Unlocking the unknown
In the ever-evolving landscape of American industry, Waste Management, Inc. and PACCAR Inc have showcased intriguing financial trajectories over the past decade. From 2014 to 2023, Waste Management, Inc. consistently outperformed PACCAR Inc in terms of gross profit, with a notable peak in 2023, reaching approximately 7.82 billion USD. This represents a robust growth of nearly 57% from its 2014 figures. Meanwhile, PACCAR Inc experienced a more volatile journey, culminating in a significant surge in 2023, with gross profits soaring to around 7.14 billion USD, marking a remarkable 156% increase from 2014. However, data for Waste Management, Inc. in 2024 remains elusive, leaving room for speculation. These insights underscore the dynamic nature of these industries, reflecting broader economic trends and strategic business decisions.
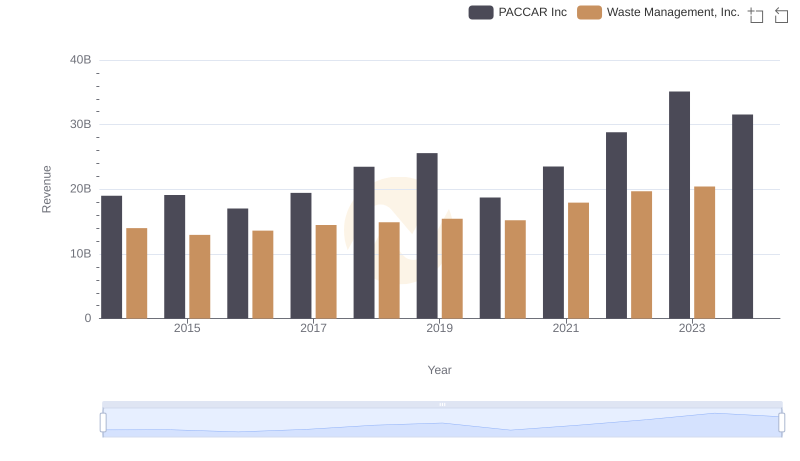
Waste Management, Inc. vs PACCAR Inc: Examining Key Revenue Metrics
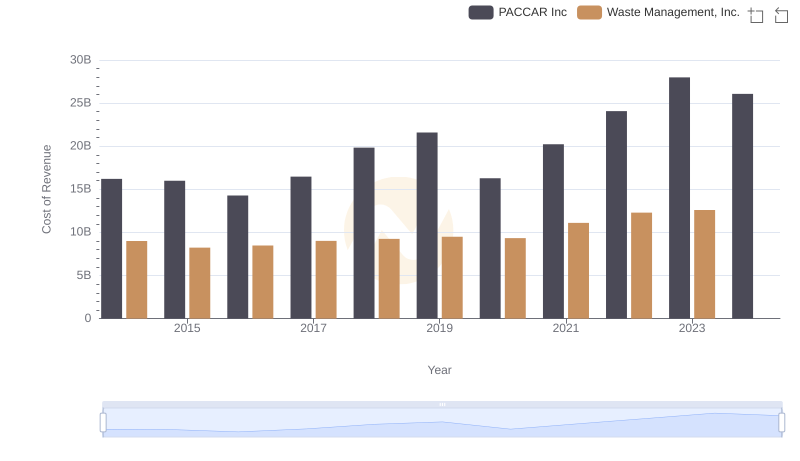
Waste Management, Inc. vs PACCAR Inc: Efficiency in Cost of Revenue Explored
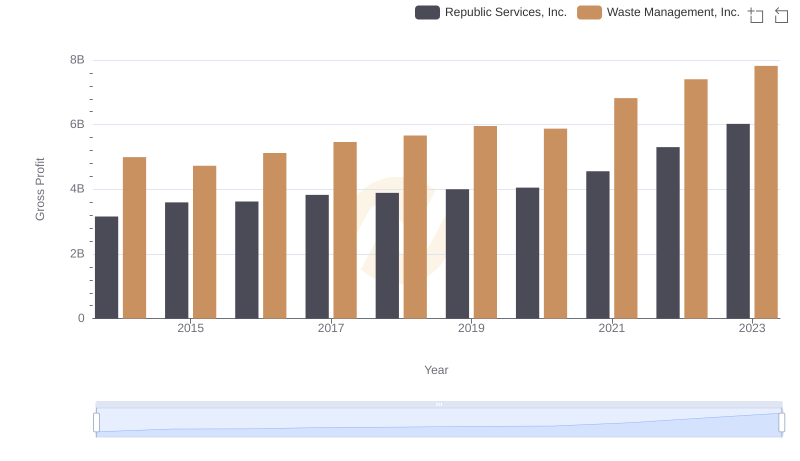
Waste Management, Inc. vs Republic Services, Inc.: A Gross Profit Performance Breakdown
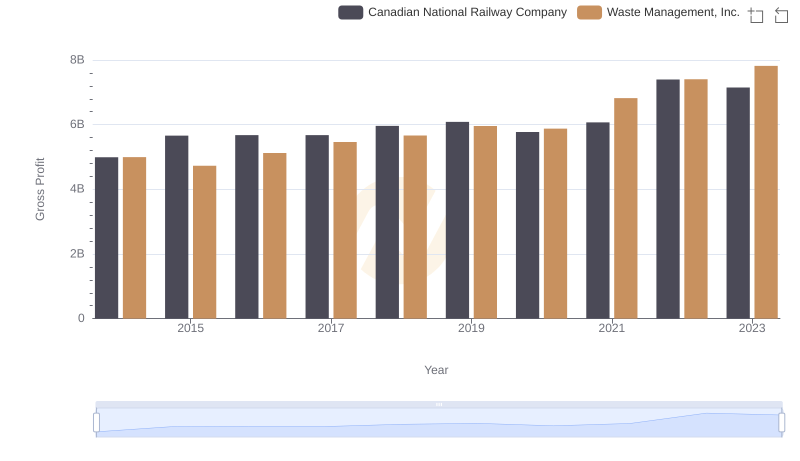
Who Generates Higher Gross Profit? Waste Management, Inc. or Canadian National Railway Company
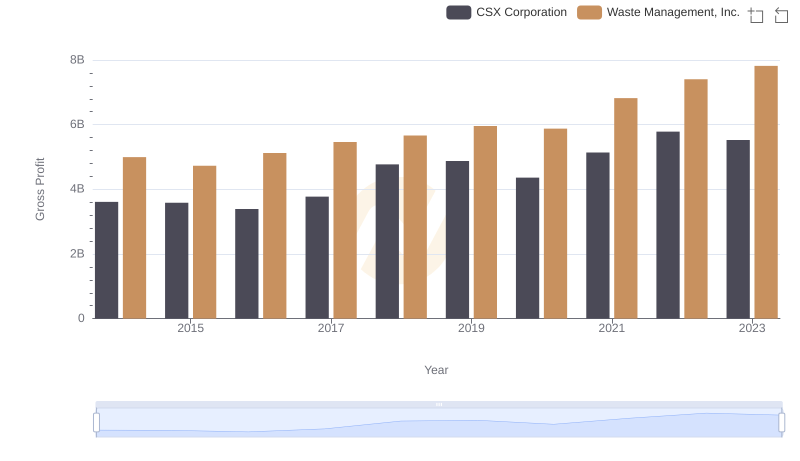
Waste Management, Inc. vs CSX Corporation: A Gross Profit Performance Breakdown
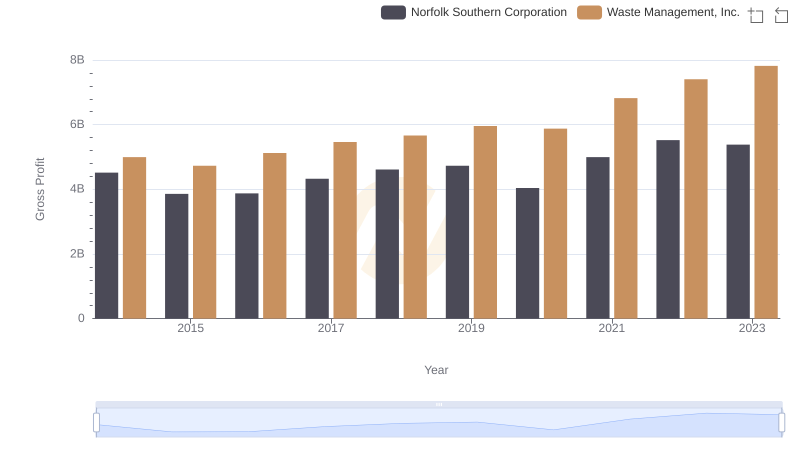
Gross Profit Analysis: Comparing Waste Management, Inc. and Norfolk Southern Corporation
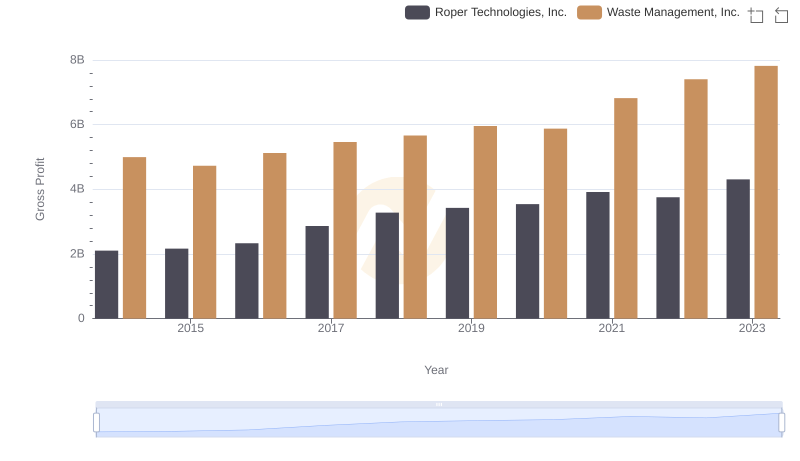
Who Generates Higher Gross Profit? Waste Management, Inc. or Roper Technologies, Inc.
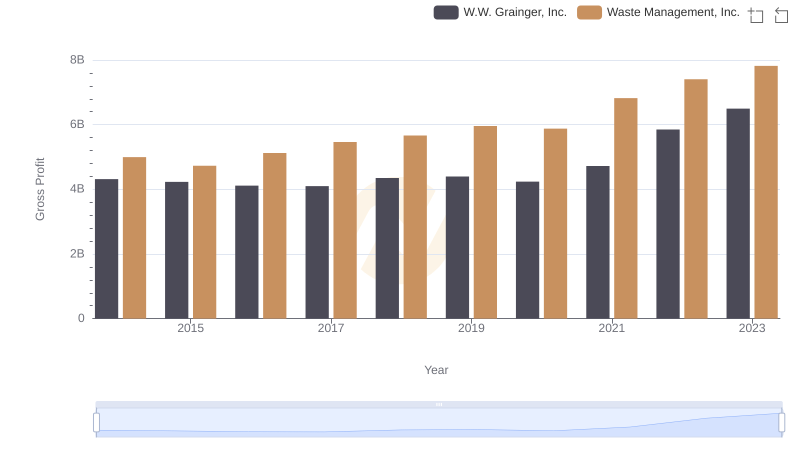
Gross Profit Trends Compared: Waste Management, Inc. vs W.W. Grainger, Inc.
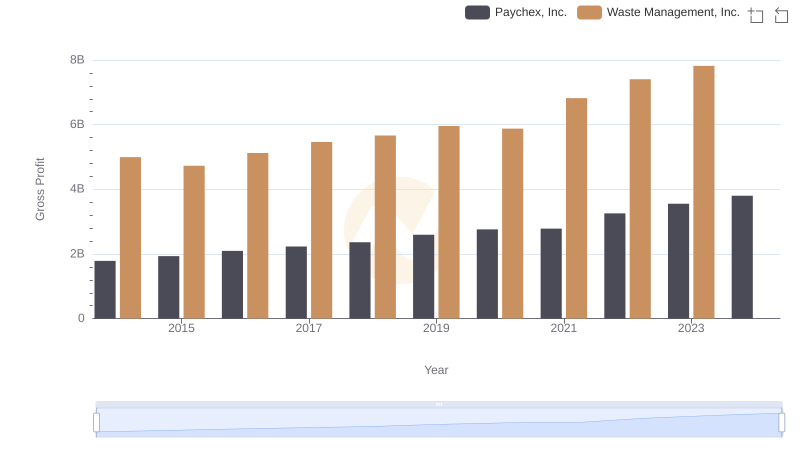
Gross Profit Comparison: Waste Management, Inc. and Paychex, Inc. Trends
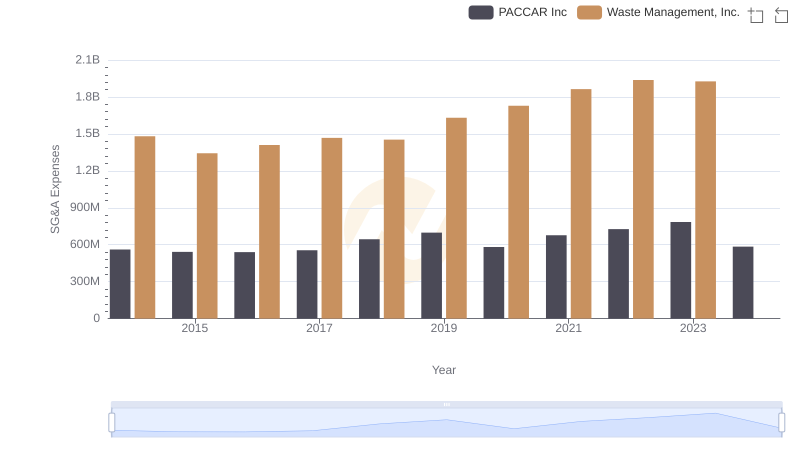
Waste Management, Inc. and PACCAR Inc: SG&A Spending Patterns Compared
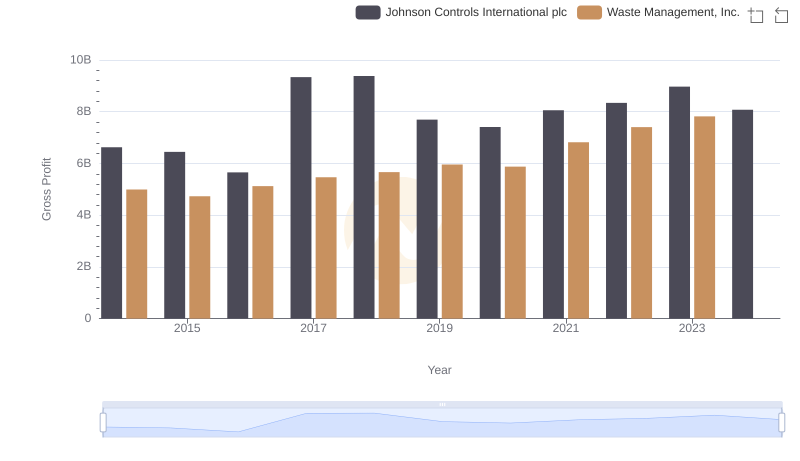
Waste Management, Inc. and Johnson Controls International plc: A Detailed Gross Profit Analysis
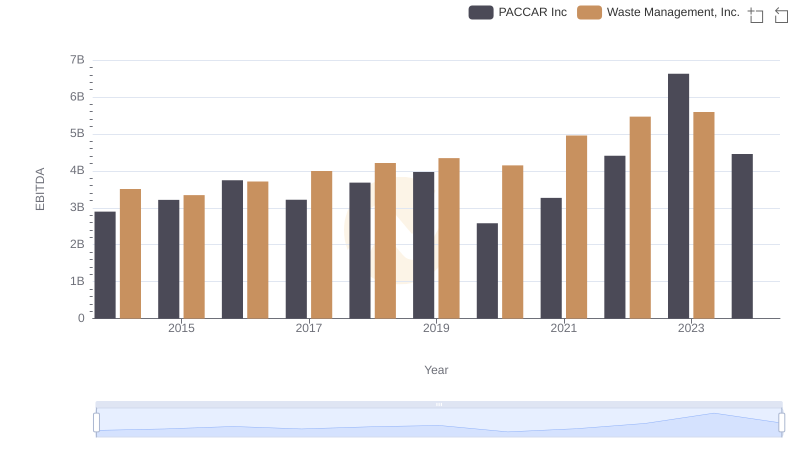
Comprehensive EBITDA Comparison: Waste Management, Inc. vs PACCAR Inc