| __timestamp | CSX Corporation | Waste Management, Inc. |
|---|---|---|
| Wednesday, January 1, 2014 | 3613000000 | 4994000000 |
| Thursday, January 1, 2015 | 3584000000 | 4730000000 |
| Friday, January 1, 2016 | 3389000000 | 5123000000 |
| Sunday, January 1, 2017 | 3773000000 | 5464000000 |
| Monday, January 1, 2018 | 4773000000 | 5665000000 |
| Tuesday, January 1, 2019 | 4874000000 | 5959000000 |
| Wednesday, January 1, 2020 | 4362000000 | 5877000000 |
| Friday, January 1, 2021 | 5140000000 | 6820000000 |
| Saturday, January 1, 2022 | 5785000000 | 7404000000 |
| Sunday, January 1, 2023 | 5527000000 | 7820000000 |
| Monday, January 1, 2024 | 8680000000 |
Igniting the spark of knowledge
In the ever-evolving landscape of American industry, Waste Management, Inc. and CSX Corporation stand as titans in their respective fields. Over the past decade, from 2014 to 2023, these companies have showcased remarkable growth in gross profit, reflecting their resilience and strategic prowess.
Waste Management, Inc. has consistently outperformed CSX Corporation, with an average gross profit approximately 33% higher. Notably, in 2023, Waste Management's gross profit surged to 7.82 billion, marking a 57% increase from 2014. Meanwhile, CSX Corporation also demonstrated robust growth, achieving a 53% rise in gross profit over the same period, peaking at 5.79 billion in 2022.
This performance breakdown not only highlights the financial health of these industry leaders but also underscores the dynamic nature of the sectors they operate in, offering valuable insights for investors and industry analysts alike.
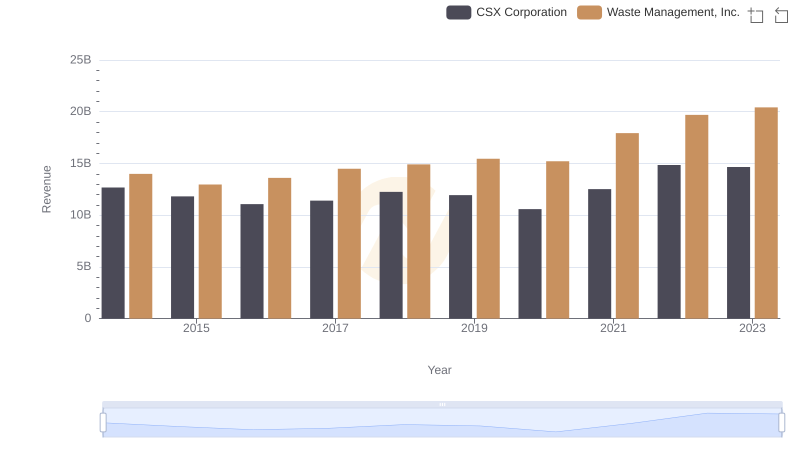
Waste Management, Inc. vs CSX Corporation: Annual Revenue Growth Compared
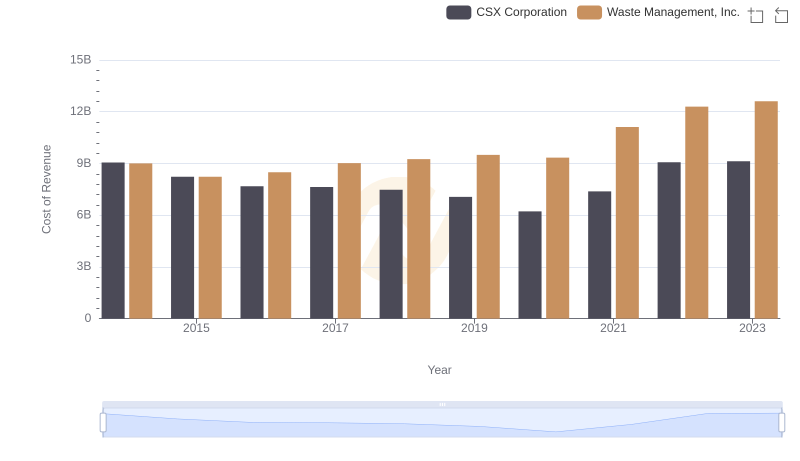
Cost of Revenue Comparison: Waste Management, Inc. vs CSX Corporation
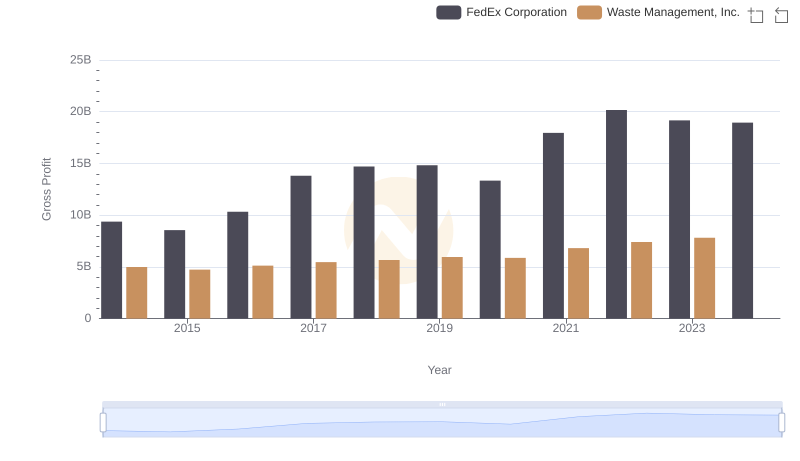
Gross Profit Analysis: Comparing Waste Management, Inc. and FedEx Corporation
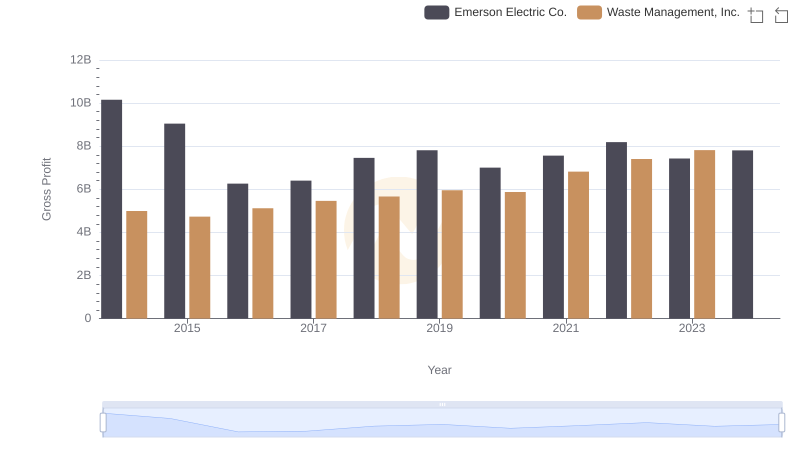
Who Generates Higher Gross Profit? Waste Management, Inc. or Emerson Electric Co.
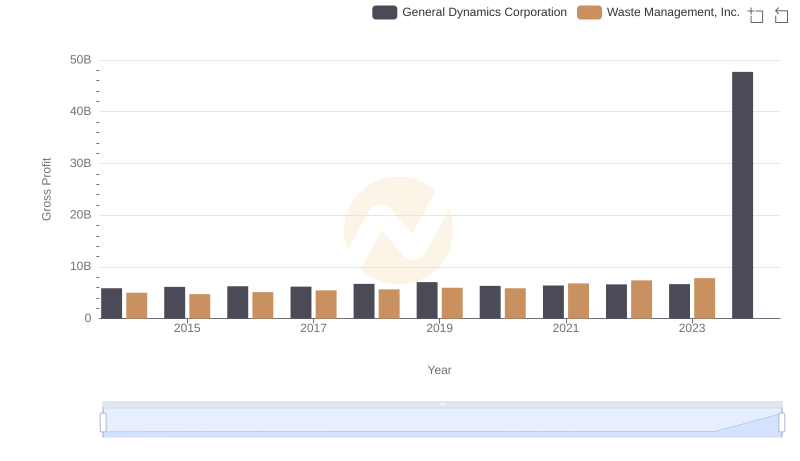
Gross Profit Trends Compared: Waste Management, Inc. vs General Dynamics Corporation
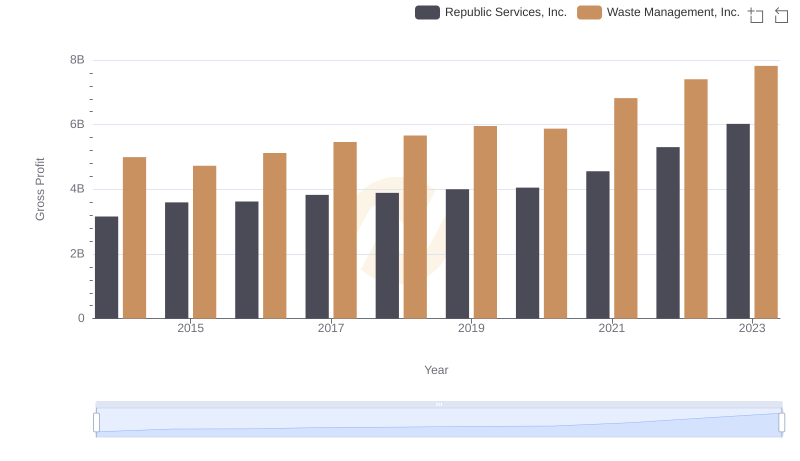
Waste Management, Inc. vs Republic Services, Inc.: A Gross Profit Performance Breakdown
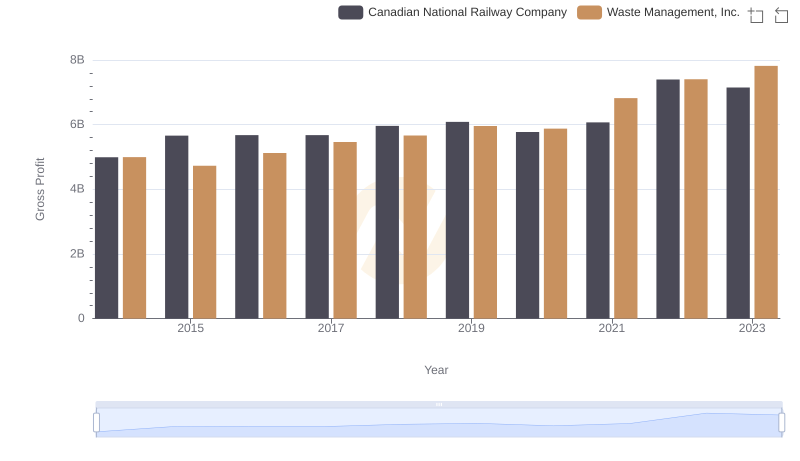
Who Generates Higher Gross Profit? Waste Management, Inc. or Canadian National Railway Company
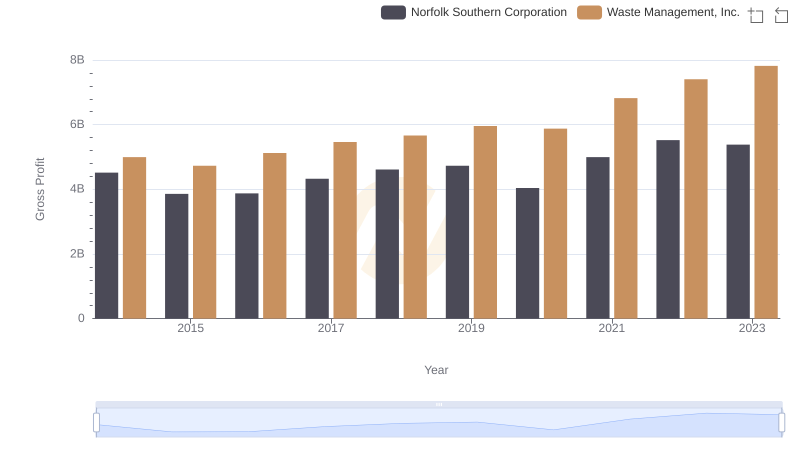
Gross Profit Analysis: Comparing Waste Management, Inc. and Norfolk Southern Corporation
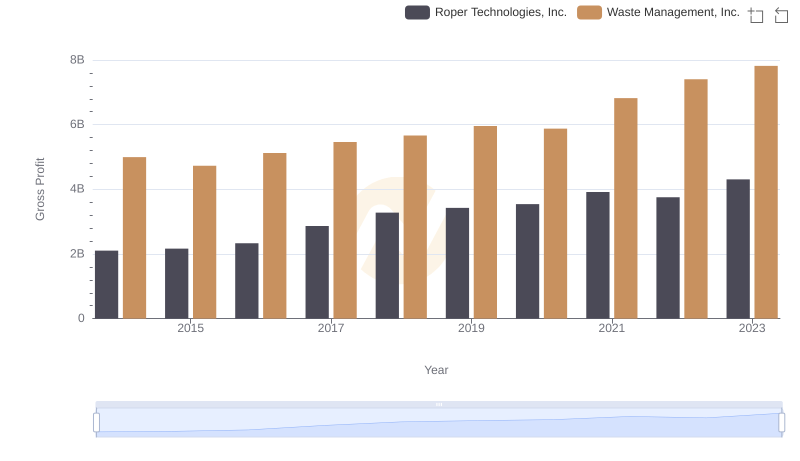
Who Generates Higher Gross Profit? Waste Management, Inc. or Roper Technologies, Inc.
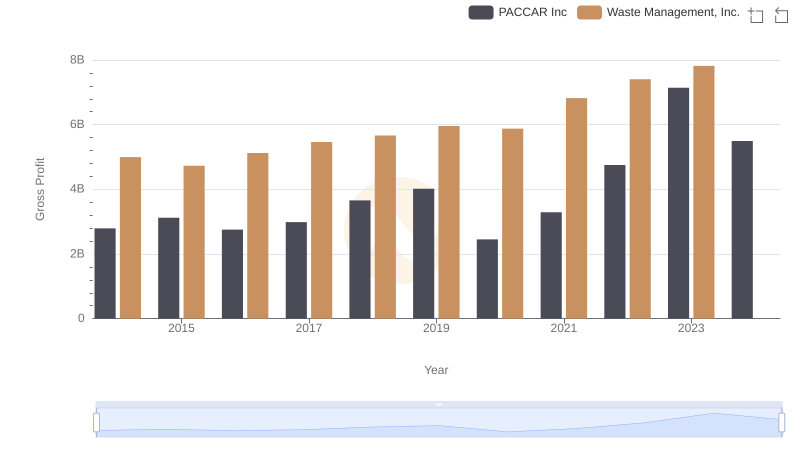
Key Insights on Gross Profit: Waste Management, Inc. vs PACCAR Inc
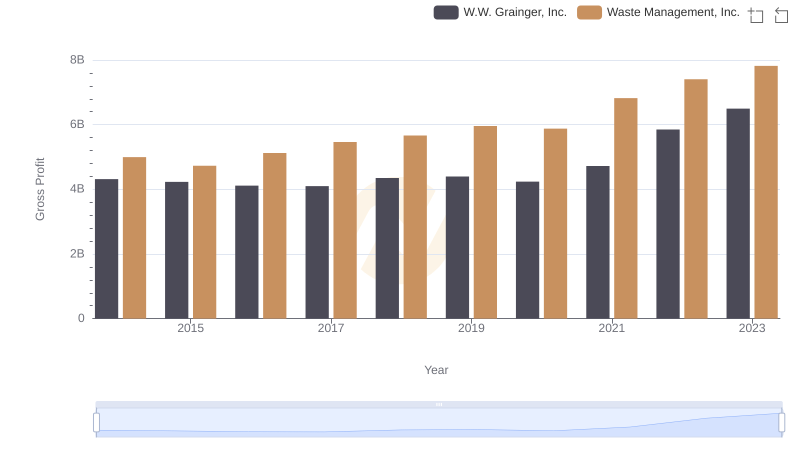
Gross Profit Trends Compared: Waste Management, Inc. vs W.W. Grainger, Inc.
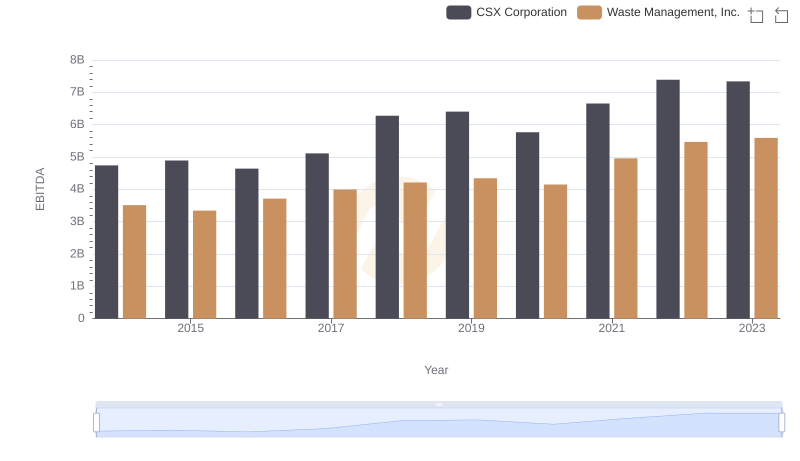
A Professional Review of EBITDA: Waste Management, Inc. Compared to CSX Corporation