| __timestamp | Hubbell Incorporated | Trane Technologies plc |
|---|---|---|
| Wednesday, January 1, 2014 | 1109000000 | 3908600000 |
| Thursday, January 1, 2015 | 1091800000 | 3999100000 |
| Friday, January 1, 2016 | 1100700000 | 4179600000 |
| Sunday, January 1, 2017 | 1151900000 | 4386000000 |
| Monday, January 1, 2018 | 1300400000 | 4820600000 |
| Tuesday, January 1, 2019 | 1352700000 | 5147400000 |
| Wednesday, January 1, 2020 | 1209300000 | 3803400000 |
| Friday, January 1, 2021 | 1151500000 | 4469600000 |
| Saturday, January 1, 2022 | 1471600000 | 4964800000 |
| Sunday, January 1, 2023 | 1888100000 | 5857200000 |
| Monday, January 1, 2024 | 1904100000 | 7080500000 |
Igniting the spark of knowledge
In the competitive landscape of industrial manufacturing, Trane Technologies plc and Hubbell Incorporated have showcased distinct trajectories in their gross profit trends over the past decade. From 2014 to 2023, Trane Technologies consistently outperformed Hubbell, with its gross profit peaking at approximately $5.86 billion in 2023, marking a 50% increase from 2014. In contrast, Hubbell's gross profit, while showing a steady rise, reached its highest at $1.89 billion in 2023, reflecting a 70% growth over the same period.
The data highlights a significant recovery for both companies post-2020, a year marked by global economic challenges. Trane Technologies rebounded with a 54% increase in gross profit from 2020 to 2023, while Hubbell saw a remarkable 56% rise. These trends underscore the resilience and strategic prowess of these industrial giants in navigating market fluctuations.

Breaking Down Revenue Trends: Trane Technologies plc vs Hubbell Incorporated
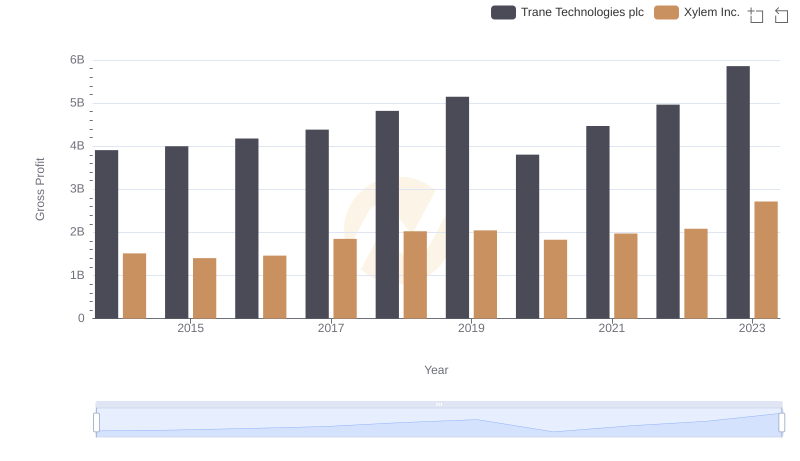
Trane Technologies plc vs Xylem Inc.: A Gross Profit Performance Breakdown
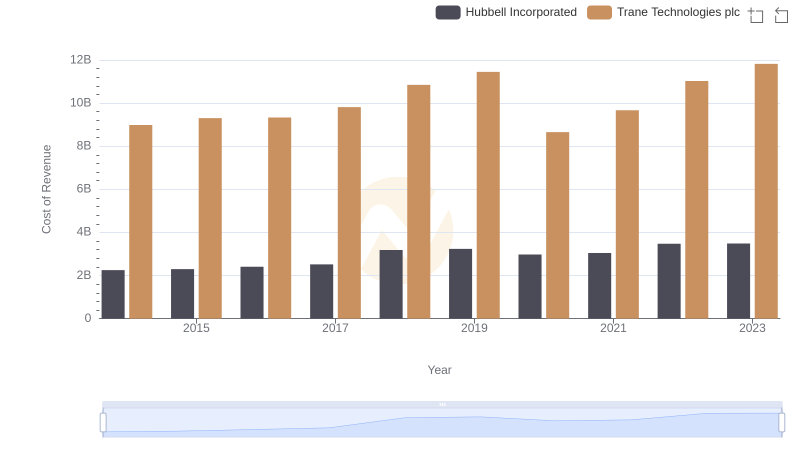
Analyzing Cost of Revenue: Trane Technologies plc and Hubbell Incorporated
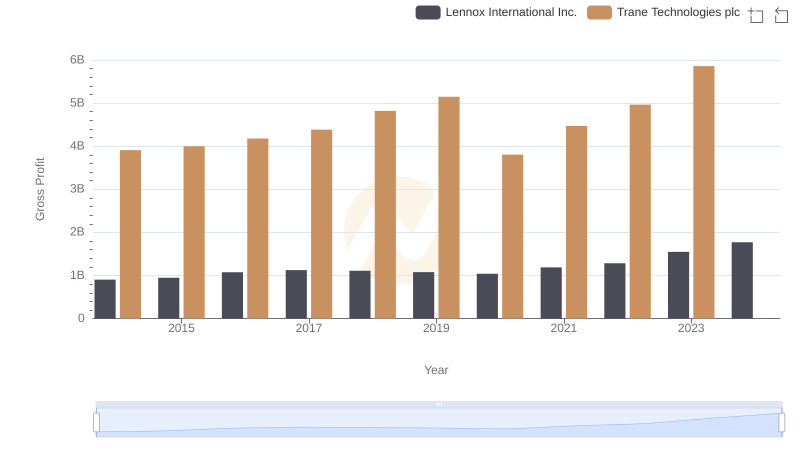
Trane Technologies plc and Lennox International Inc.: A Detailed Gross Profit Analysis
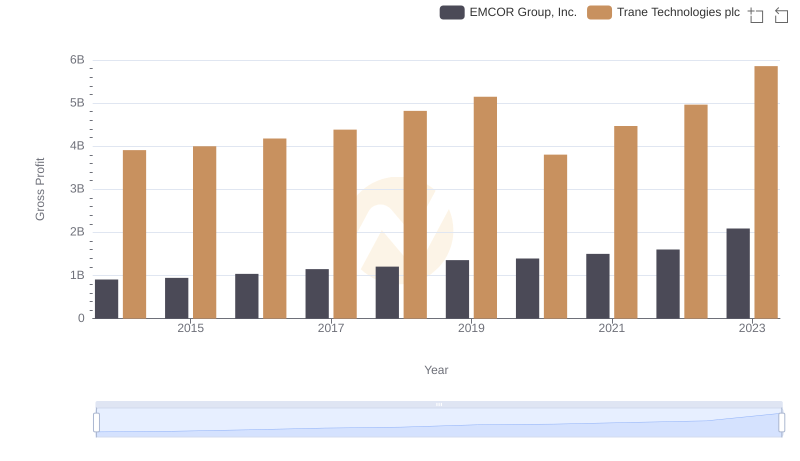
Gross Profit Trends Compared: Trane Technologies plc vs EMCOR Group, Inc.
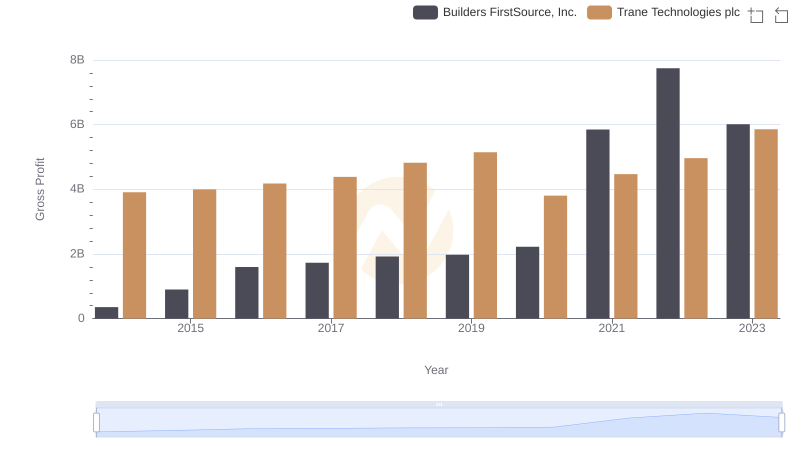
Who Generates Higher Gross Profit? Trane Technologies plc or Builders FirstSource, Inc.
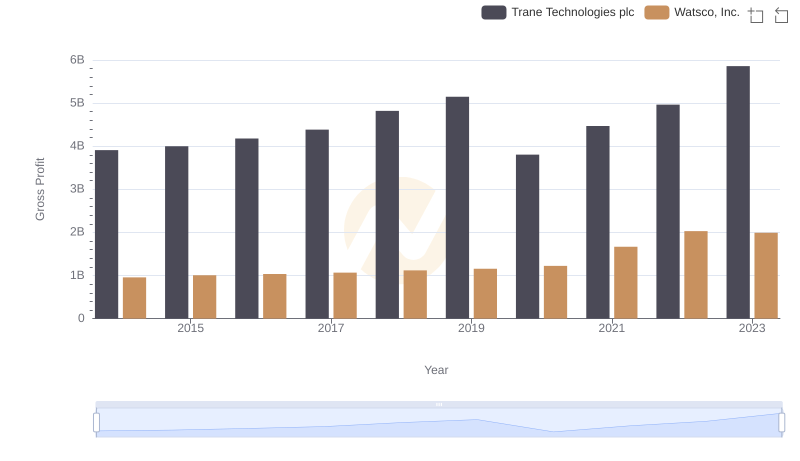
Trane Technologies plc vs Watsco, Inc.: A Gross Profit Performance Breakdown
Gross Profit Trends Compared: Trane Technologies plc vs AerCap Holdings N.V.
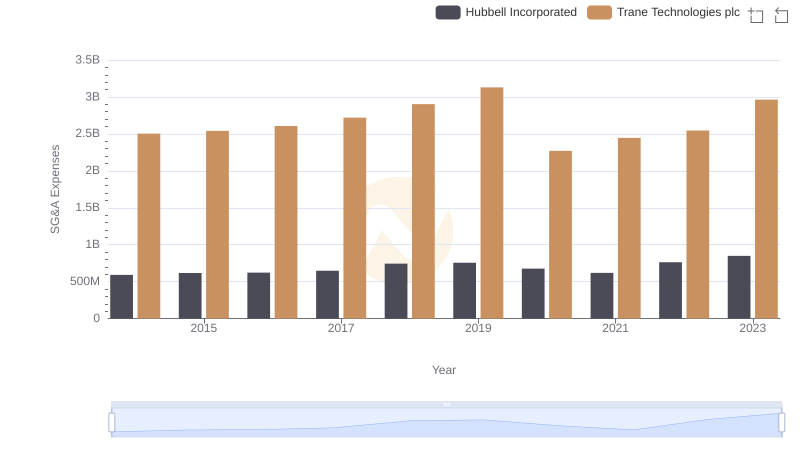
SG&A Efficiency Analysis: Comparing Trane Technologies plc and Hubbell Incorporated
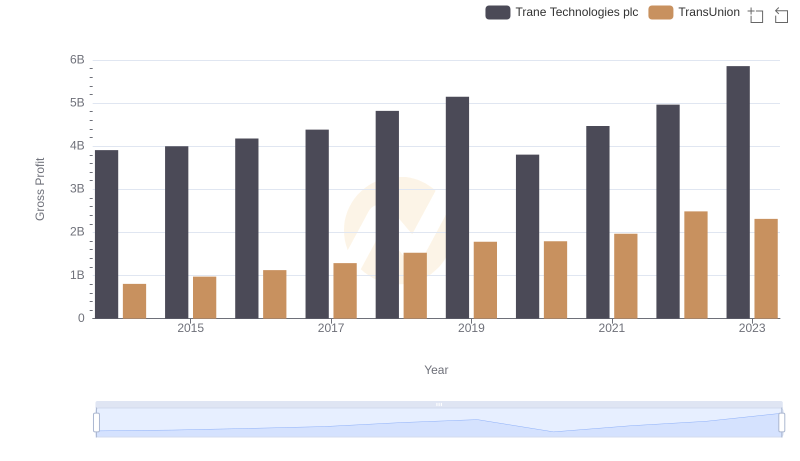
Who Generates Higher Gross Profit? Trane Technologies plc or TransUnion
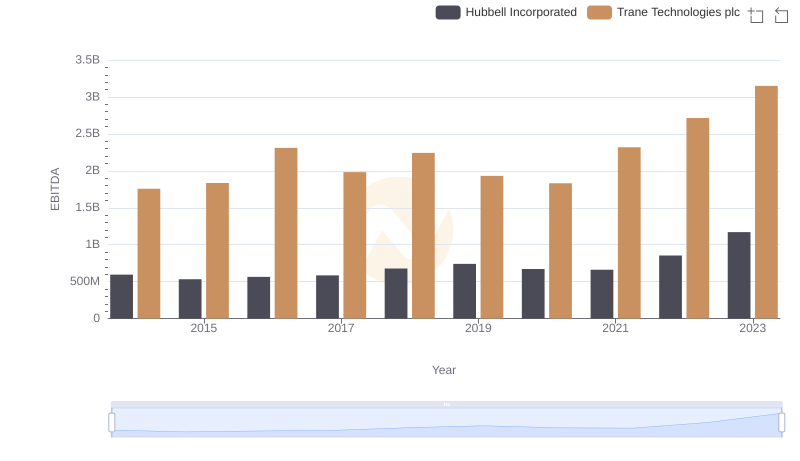
Trane Technologies plc and Hubbell Incorporated: A Detailed Examination of EBITDA Performance