| __timestamp | Hubbell Incorporated | Trane Technologies plc |
|---|---|---|
| Wednesday, January 1, 2014 | 3359400000 | 12891400000 |
| Thursday, January 1, 2015 | 3390400000 | 13300700000 |
| Friday, January 1, 2016 | 3505200000 | 13508900000 |
| Sunday, January 1, 2017 | 3668800000 | 14197600000 |
| Monday, January 1, 2018 | 4481700000 | 15668200000 |
| Tuesday, January 1, 2019 | 4591000000 | 16598900000 |
| Wednesday, January 1, 2020 | 4186000000 | 12454700000 |
| Friday, January 1, 2021 | 4194100000 | 14136400000 |
| Saturday, January 1, 2022 | 4947900000 | 15991700000 |
| Sunday, January 1, 2023 | 5372900000 | 17677600000 |
| Monday, January 1, 2024 | 5628500000 | 19838200000 |
Unveiling the hidden dimensions of data
In the ever-evolving landscape of industrial innovation, Trane Technologies plc and Hubbell Incorporated have emerged as key players. Over the past decade, from 2014 to 2023, these companies have demonstrated distinct revenue trajectories. Trane Technologies, a leader in climate solutions, has seen its revenue grow by approximately 37%, reaching a peak in 2023. This growth underscores its strategic focus on sustainability and energy efficiency.
Conversely, Hubbell Incorporated, known for its electrical and utility solutions, has experienced a steady revenue increase of about 60% over the same period. This growth reflects its robust market presence and adaptability in the face of technological advancements.
The data reveals a compelling narrative of resilience and innovation, with both companies capitalizing on their unique strengths to navigate the challenges of the modern industrial sector.
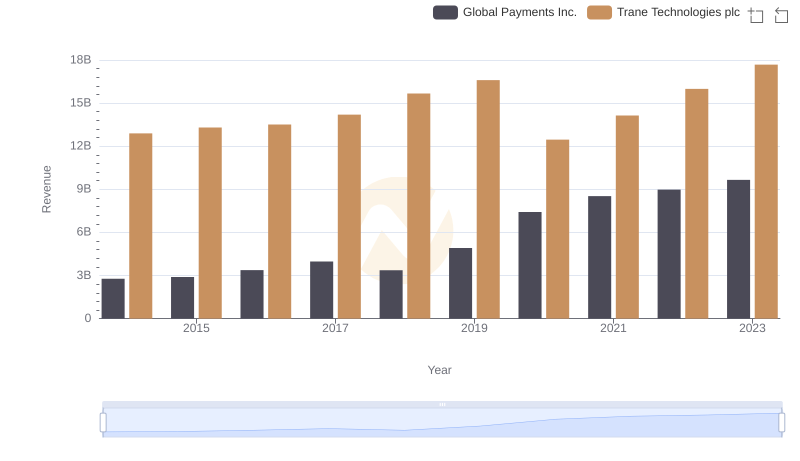
Trane Technologies plc and Global Payments Inc.: A Comprehensive Revenue Analysis
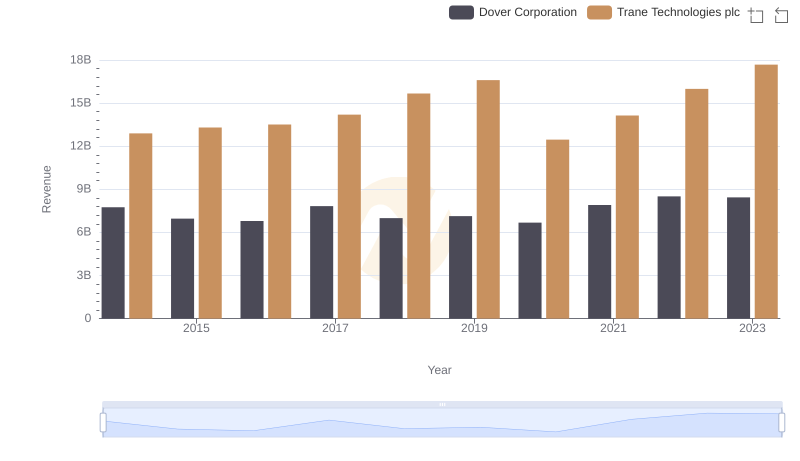
Annual Revenue Comparison: Trane Technologies plc vs Dover Corporation
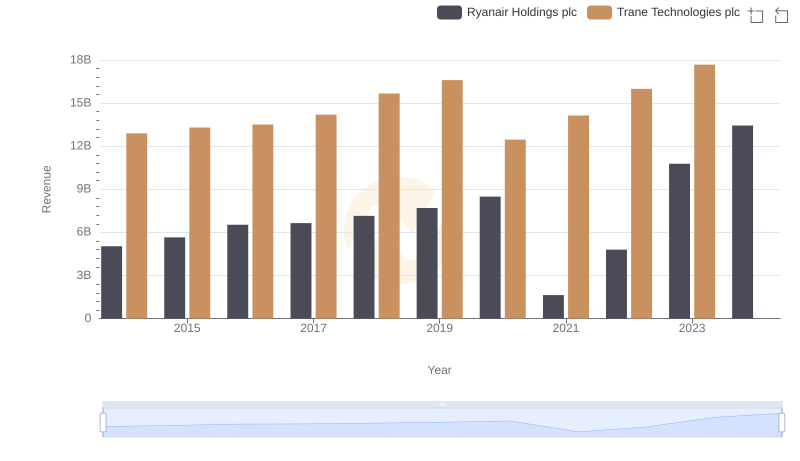
Annual Revenue Comparison: Trane Technologies plc vs Ryanair Holdings plc
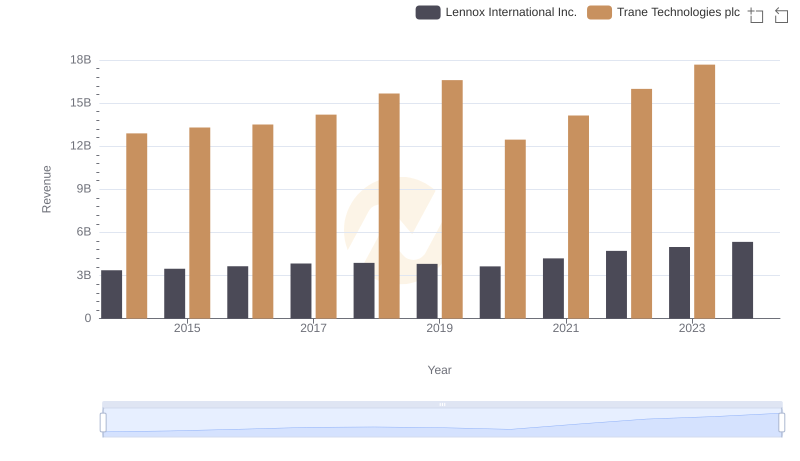
Trane Technologies plc vs Lennox International Inc.: Examining Key Revenue Metrics
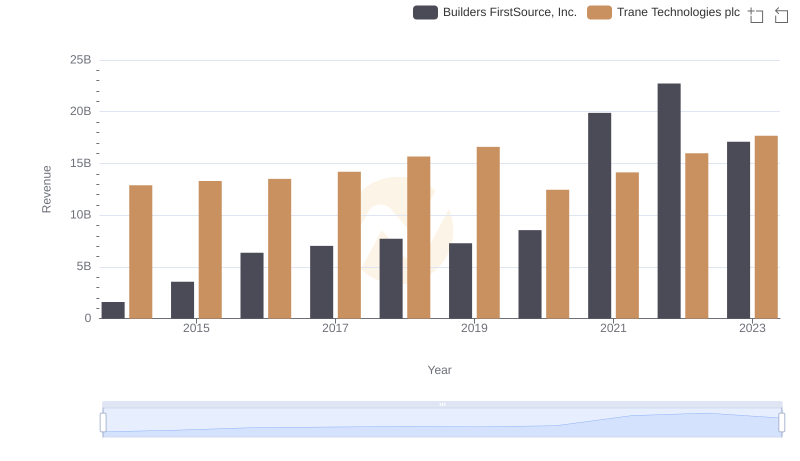
Trane Technologies plc vs Builders FirstSource, Inc.: Examining Key Revenue Metrics
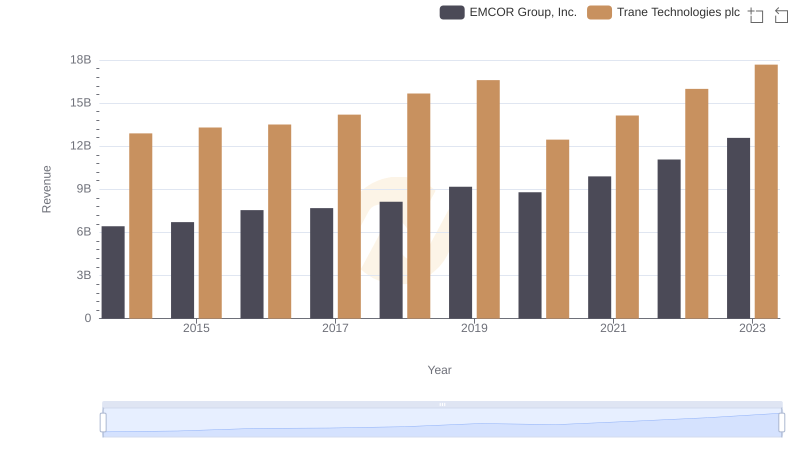
Trane Technologies plc and EMCOR Group, Inc.: A Comprehensive Revenue Analysis
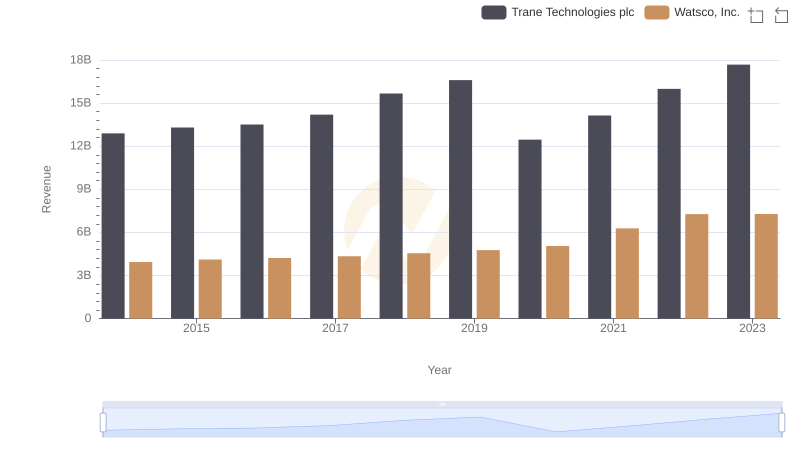
Trane Technologies plc or Watsco, Inc.: Who Leads in Yearly Revenue?
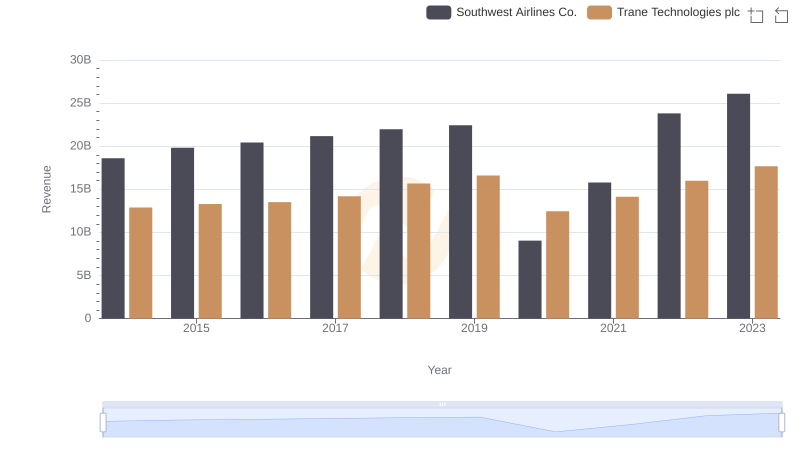
Comparing Revenue Performance: Trane Technologies plc or Southwest Airlines Co.?
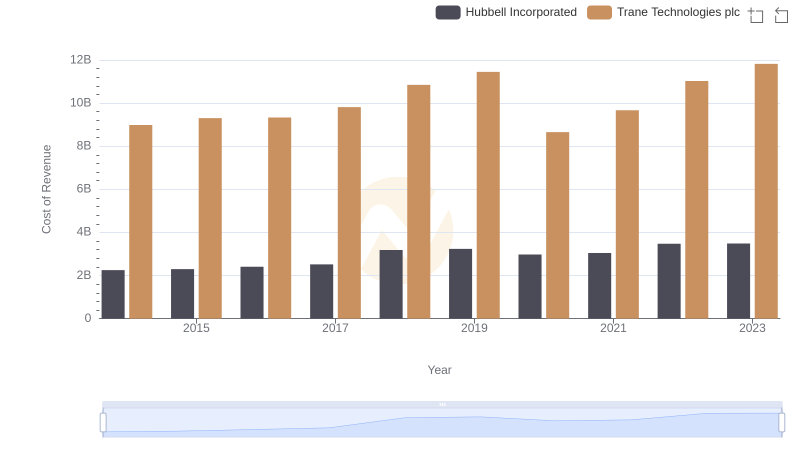
Analyzing Cost of Revenue: Trane Technologies plc and Hubbell Incorporated

Gross Profit Trends Compared: Trane Technologies plc vs Hubbell Incorporated
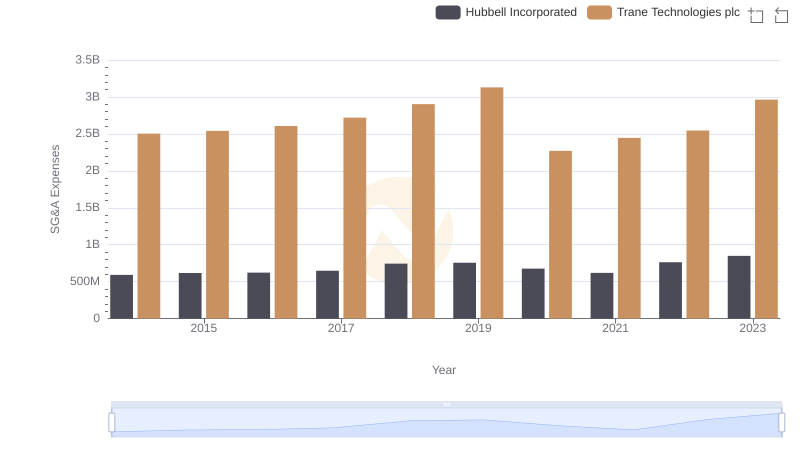
SG&A Efficiency Analysis: Comparing Trane Technologies plc and Hubbell Incorporated
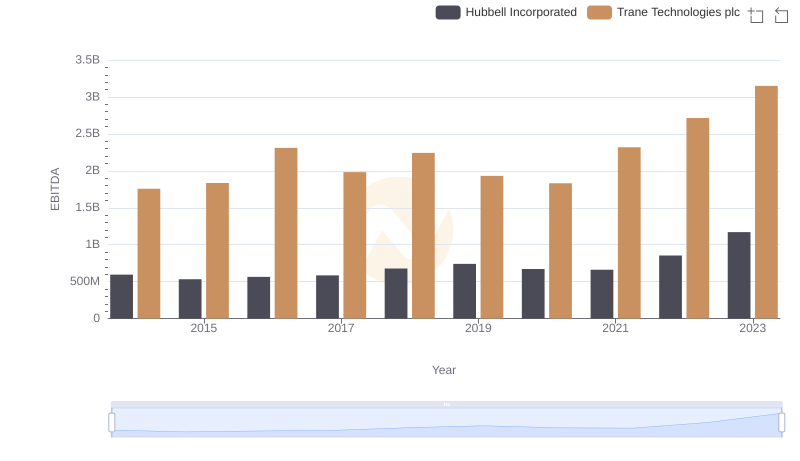
Trane Technologies plc and Hubbell Incorporated: A Detailed Examination of EBITDA Performance