| __timestamp | Lennox International Inc. | Trane Technologies plc |
|---|---|---|
| Wednesday, January 1, 2014 | 903300000 | 3908600000 |
| Thursday, January 1, 2015 | 947400000 | 3999100000 |
| Friday, January 1, 2016 | 1076500000 | 4179600000 |
| Sunday, January 1, 2017 | 1125200000 | 4386000000 |
| Monday, January 1, 2018 | 1111200000 | 4820600000 |
| Tuesday, January 1, 2019 | 1079800000 | 5147400000 |
| Wednesday, January 1, 2020 | 1040100000 | 3803400000 |
| Friday, January 1, 2021 | 1188400000 | 4469600000 |
| Saturday, January 1, 2022 | 1284700000 | 4964800000 |
| Sunday, January 1, 2023 | 1547800000 | 5857200000 |
| Monday, January 1, 2024 | 1771900000 | 7080500000 |
In pursuit of knowledge
In the ever-evolving landscape of the HVAC industry, Trane Technologies plc and Lennox International Inc. have emerged as formidable players. Over the past decade, Trane Technologies has consistently outperformed Lennox International in terms of gross profit, showcasing a robust growth trajectory. From 2014 to 2023, Trane Technologies' gross profit surged by approximately 50%, peaking in 2023 with a remarkable 5.86 billion. In contrast, Lennox International demonstrated a steady, albeit slower, growth rate of around 70% over the same period, reaching 1.77 billion in 2024.
The data reveals a compelling narrative of resilience and strategic prowess, with Trane Technologies maintaining a significant lead. However, Lennox International's recent uptick suggests a potential shift in market dynamics. As we look to the future, the question remains: Can Lennox International close the gap, or will Trane Technologies continue to dominate?
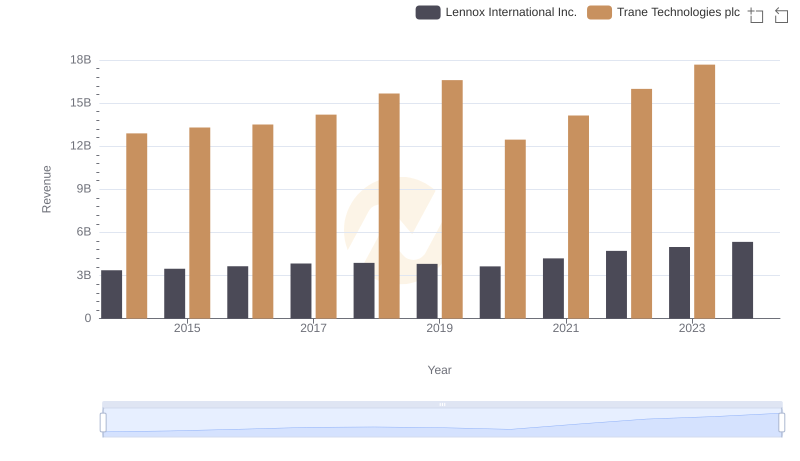
Trane Technologies plc vs Lennox International Inc.: Examining Key Revenue Metrics
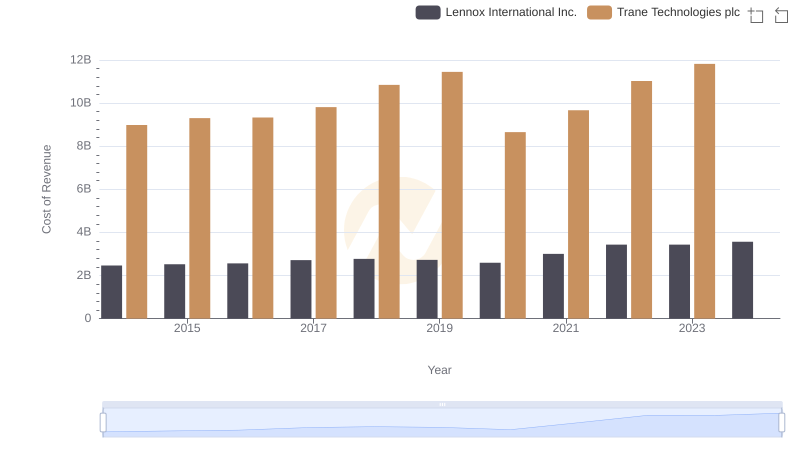
Cost Insights: Breaking Down Trane Technologies plc and Lennox International Inc.'s Expenses
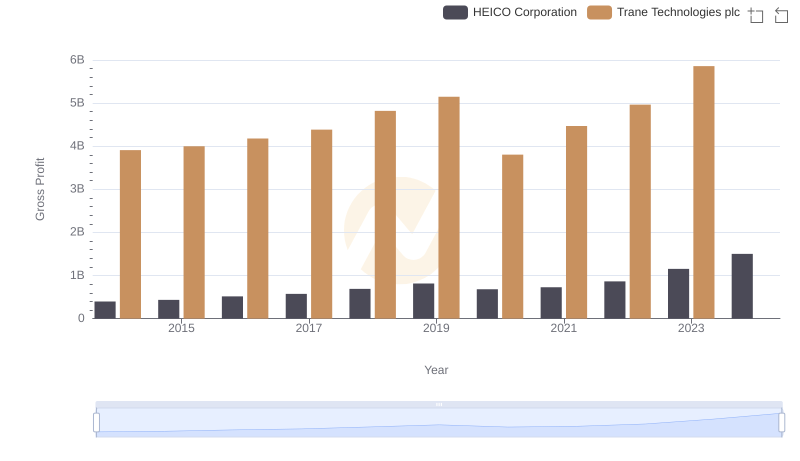
Who Generates Higher Gross Profit? Trane Technologies plc or HEICO Corporation
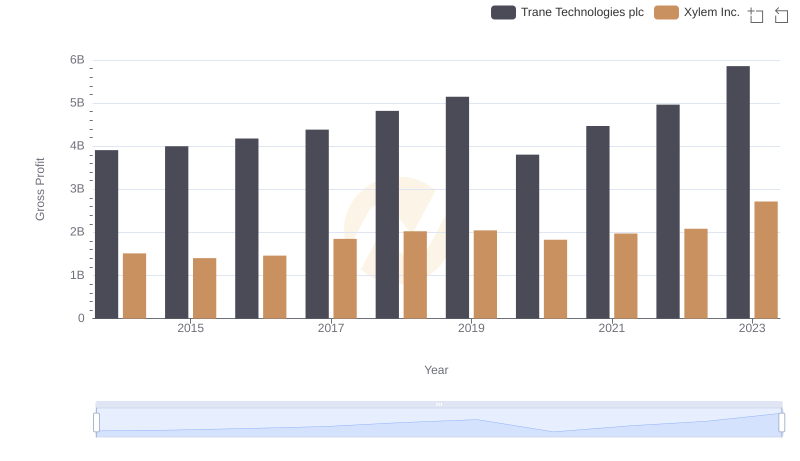
Trane Technologies plc vs Xylem Inc.: A Gross Profit Performance Breakdown
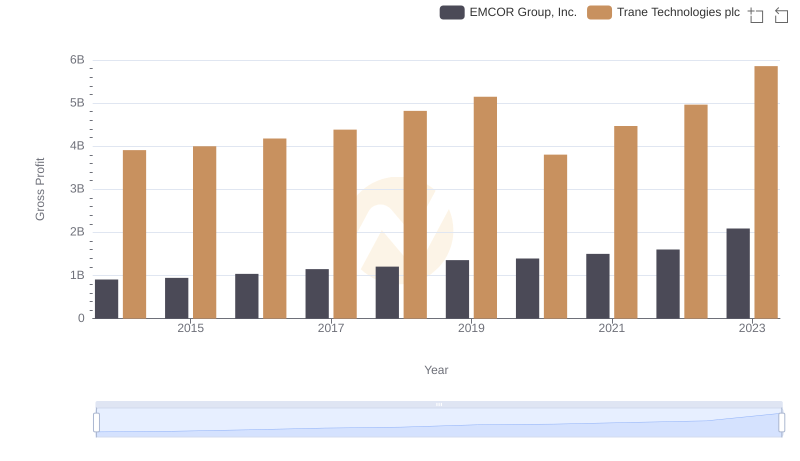
Gross Profit Trends Compared: Trane Technologies plc vs EMCOR Group, Inc.
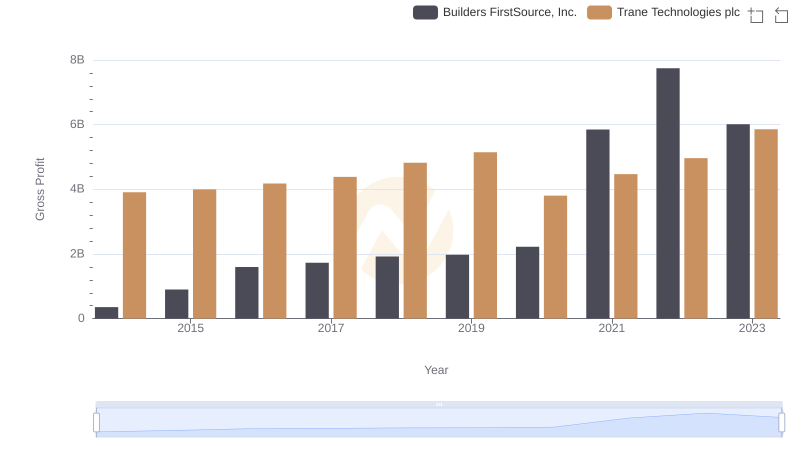
Who Generates Higher Gross Profit? Trane Technologies plc or Builders FirstSource, Inc.
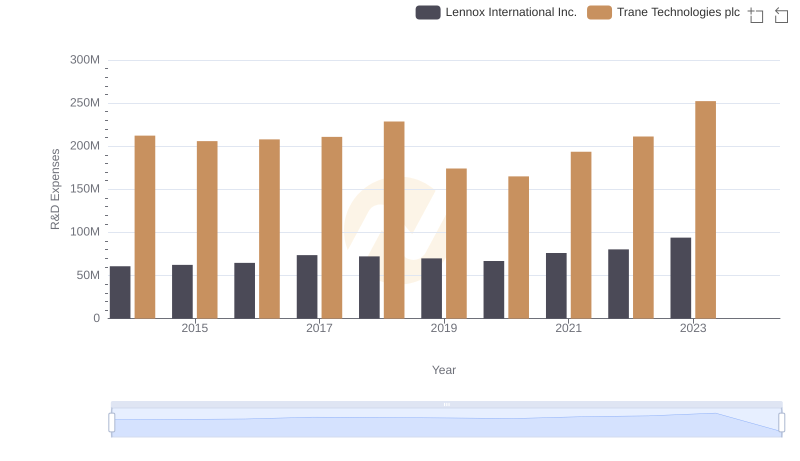
R&D Spending Showdown: Trane Technologies plc vs Lennox International Inc.

Gross Profit Trends Compared: Trane Technologies plc vs Hubbell Incorporated
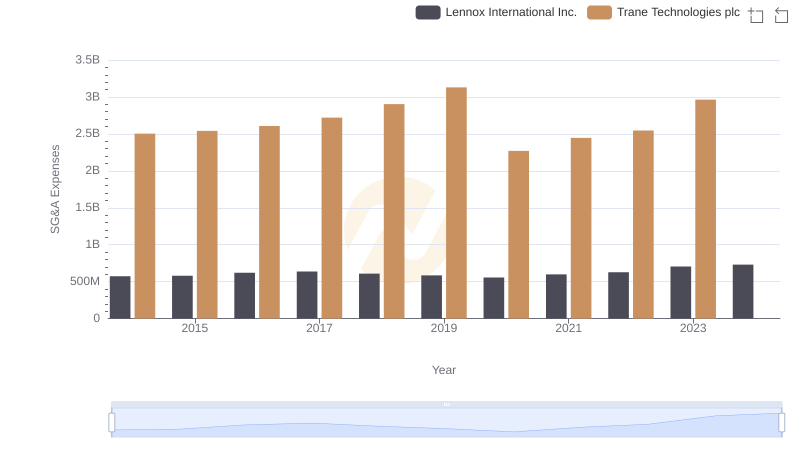
Selling, General, and Administrative Costs: Trane Technologies plc vs Lennox International Inc.
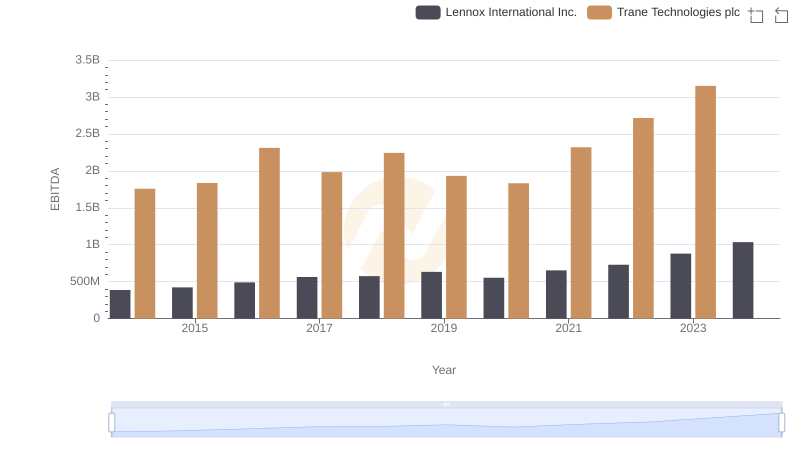
EBITDA Analysis: Evaluating Trane Technologies plc Against Lennox International Inc.