| __timestamp | Builders FirstSource, Inc. | Trane Technologies plc |
|---|---|---|
| Wednesday, January 1, 2014 | 356997000 | 3908600000 |
| Thursday, January 1, 2015 | 901458000 | 3999100000 |
| Friday, January 1, 2016 | 1596748000 | 4179600000 |
| Sunday, January 1, 2017 | 1727391000 | 4386000000 |
| Monday, January 1, 2018 | 1922940000 | 4820600000 |
| Tuesday, January 1, 2019 | 1976829000 | 5147400000 |
| Wednesday, January 1, 2020 | 2222584000 | 3803400000 |
| Friday, January 1, 2021 | 5850956000 | 4469600000 |
| Saturday, January 1, 2022 | 7744379000 | 4964800000 |
| Sunday, January 1, 2023 | 6012334000 | 5857200000 |
| Monday, January 1, 2024 | 7080500000 |
Unlocking the unknown
In the competitive landscape of industrial giants, Trane Technologies plc and Builders FirstSource, Inc. have been vying for dominance in gross profit generation over the past decade. From 2014 to 2023, Trane Technologies consistently outperformed Builders FirstSource, with an average gross profit of approximately $4.55 billion annually. However, the narrative took a dramatic turn in 2021 when Builders FirstSource surged ahead, achieving a remarkable 32% increase in gross profit compared to the previous year, reaching $5.85 billion. This upward trajectory continued into 2022, peaking at $7.74 billion, a staggering 60% increase from 2020. Meanwhile, Trane Technologies maintained steady growth, culminating in a gross profit of $5.86 billion in 2023. This data highlights the dynamic shifts in market leadership and underscores the resilience and strategic prowess of these industry titans.
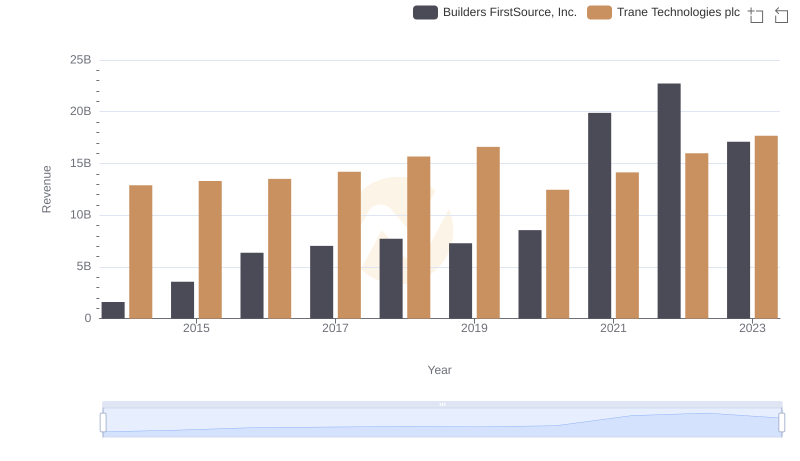
Trane Technologies plc vs Builders FirstSource, Inc.: Examining Key Revenue Metrics
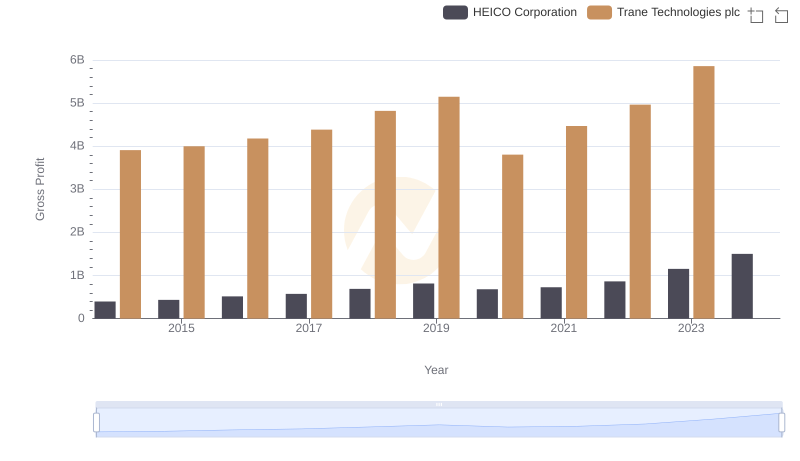
Who Generates Higher Gross Profit? Trane Technologies plc or HEICO Corporation
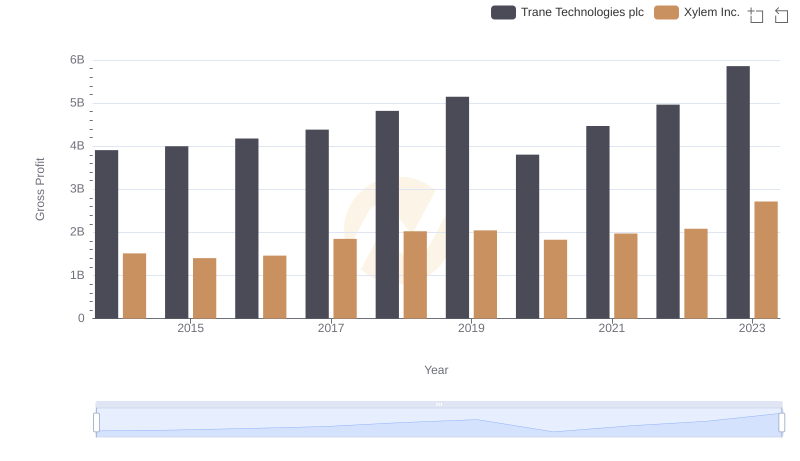
Trane Technologies plc vs Xylem Inc.: A Gross Profit Performance Breakdown
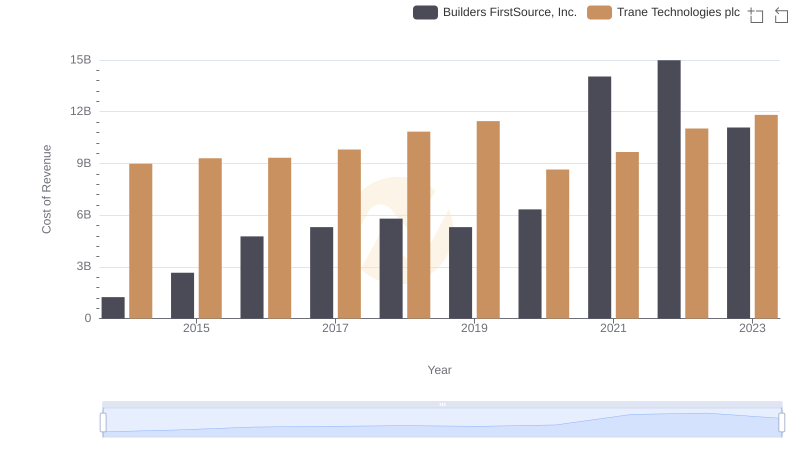
Cost of Revenue: Key Insights for Trane Technologies plc and Builders FirstSource, Inc.
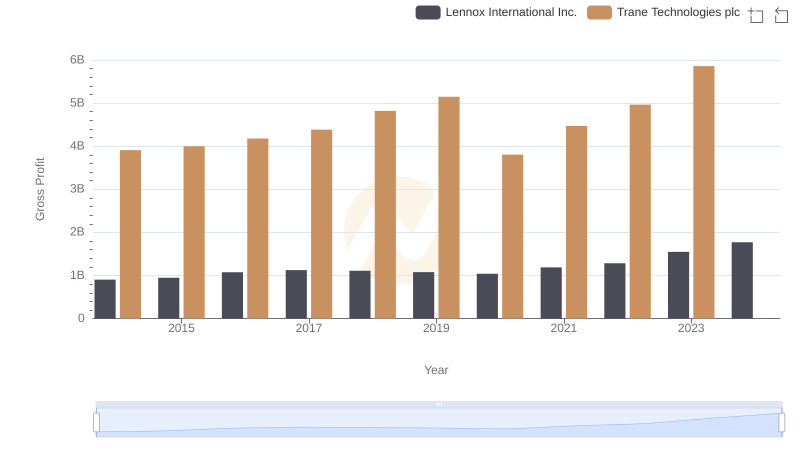
Trane Technologies plc and Lennox International Inc.: A Detailed Gross Profit Analysis
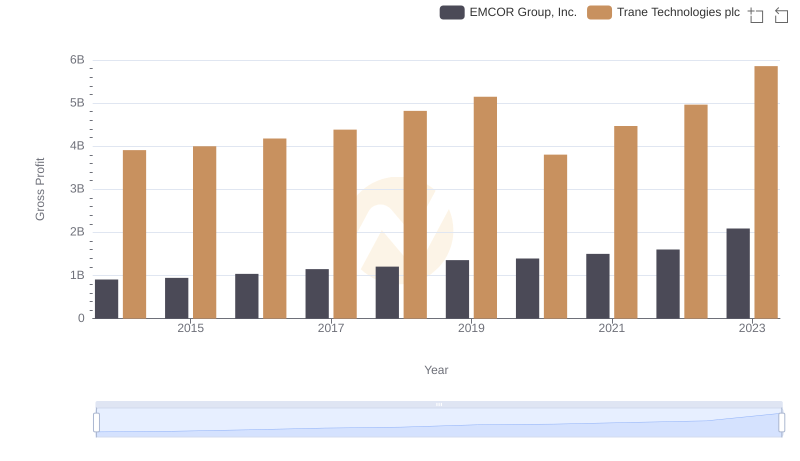
Gross Profit Trends Compared: Trane Technologies plc vs EMCOR Group, Inc.

Gross Profit Trends Compared: Trane Technologies plc vs Hubbell Incorporated
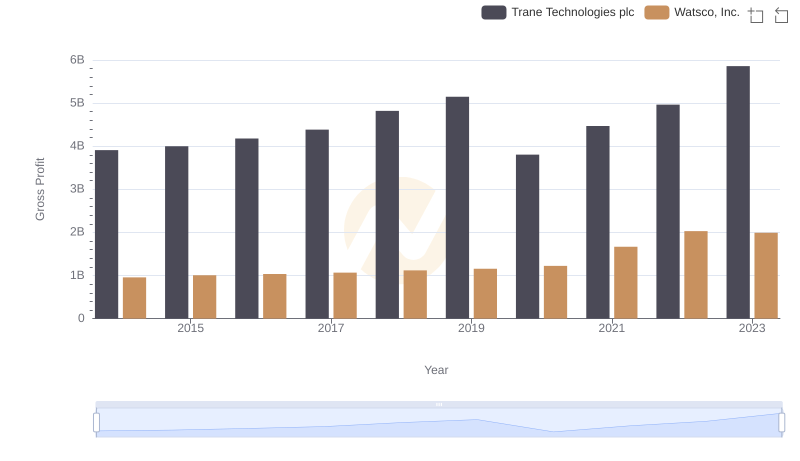
Trane Technologies plc vs Watsco, Inc.: A Gross Profit Performance Breakdown
Gross Profit Trends Compared: Trane Technologies plc vs AerCap Holdings N.V.

Cost Management Insights: SG&A Expenses for Trane Technologies plc and Builders FirstSource, Inc.
EBITDA Metrics Evaluated: Trane Technologies plc vs Builders FirstSource, Inc.